- Home
- :
- All Communities
- :
- Developers
- :
- Python
- :
- Python Questions
- :
- Re: Compiling and binning/counting raster array?
- Subscribe to RSS Feed
- Mark Topic as New
- Mark Topic as Read
- Float this Topic for Current User
- Bookmark
- Subscribe
- Mute
- Printer Friendly Page
Compiling and binning/counting raster array?
- Mark as New
- Bookmark
- Subscribe
- Mute
- Subscribe to RSS Feed
- Permalink
I am fairly new to ArcPy/Python and have been asked to do the following: Generate a histogram of bin counts based on an input 32-bit float raster image. I have generated the array for the image using ArcPy (ArcMap 10.4). The requirement is to determine the mean and stdev for this array (done as well with Numpy) and then set a new upper (max) and lower (min) value based on a 2.5 stdev spread across the mean (done too). This image data range must now go into an array with an arbitrary number of bins (say 20) each with a value width of ((new max - new min)/bins). Then I would need to count the total instances of values that fall within each bin, and plot to a histogram that can be saved. I have seen lots of promising information related to the Numpy and Matplotlib functions that can help in this regard, but can't seem to get it off the ground. At some point I will need to do the same for a variable number of input images (2 - 6 possible), determining the min and max values using stdev from all inputs, then plotting all based on this range. For now a single image would be a great start. Any suggestions greatly appreciated. Thanks.
- Mark as New
- Bookmark
- Subscribe
- Mute
- Subscribe to RSS Feed
- Permalink
A simple example
>>> a = np.arange(100).reshape(10,10)
>>> bins = np.arange(0,110, step=10)
>>> freq, upper = np.histogram(a, bins=bins)
>>> a
array([[ 0, 1, 2, 3, 4, 5, 6, 7, 8, 9],
[10, 11, 12, 13, 14, 15, 16, 17, 18, 19],
[20, 21, 22, 23, 24, 25, 26, 27, 28, 29],
[30, 31, 32, 33, 34, 35, 36, 37, 38, 39],
[40, 41, 42, 43, 44, 45, 46, 47, 48, 49],
[50, 51, 52, 53, 54, 55, 56, 57, 58, 59],
[60, 61, 62, 63, 64, 65, 66, 67, 68, 69],
[70, 71, 72, 73, 74, 75, 76, 77, 78, 79],
[80, 81, 82, 83, 84, 85, 86, 87, 88, 89],
[90, 91, 92, 93, 94, 95, 96, 97, 98, 99]])
>>> bins
array([ 0, 10, 20, 30, 40, 50, 60, 70, 80, 90, 100])
>>> freq
array([10, 10, 10, 10, 10, 10, 10, 10, 10, 10])
>>> upper
array([ 0, 10, 20, 30, 40, 50, 60, 70, 80, 90, 100])Now you can experiment with other options for testing.
Of course, you need to use RasterToNumPyArray to get rasters out to array format and reverse the process with NumPyArrayToFeatureClass..
>>> big = np.random.normal(loc=5.0, scale=1.0, size=1000000).reshape(1000,1000) # 1 million xbar, 5, std 1
>>> big.shape
(1000, 1000)
>>> big.min(), big.max()
(0.043081228374988179, 9.7109975096316425)
>>> bins = np.linspace(0,10, 5)
>>> freq, upper = np.histogram(big, bins)
>>> freq
array([ 6174, 494595, 493015, 6216])
>>> upper
array([ 0.000, 2.500, 5.000, 7.500, 10.000])
Then you are off to matplotlib or seaborn for graphing.
Check out my blog, I have numerous example of numpy use there.
- Mark as New
- Bookmark
- Subscribe
- Mute
- Subscribe to RSS Feed
- Permalink
Thanks for your help, Dan. I will give this a try.
- Mark as New
- Bookmark
- Subscribe
- Mute
- Subscribe to RSS Feed
- Permalink
So I have the array from the input raster. Is there an efficient way to define the range I want based on mean and st dev? We would like only values that fall 1.25 st dev on either side of the mean. I found the numpy.clip function but it seems to reset data values above and below the specified min/max thresholds to those thresholds and what I need is to eliminate those values completely. I have extracted the mean and st dev from the original array as follows (sdFact previously defined as 2.5):
#Calculate the min, max, mean and standard deviation of the array
testImage_min = np.min(testImage_arr)
testImage_max = np.max(testImage_arr)
testImage_mean = np.mean(testImage_arr)
testImage_std = np.std(testImage_arr)
#Calculate a min and max based on sdFact, mean, and sdev
arr_min = (testImage_mean - (sdFact/2) * testImage_std)
arr_max = (testImage_mean + (sdFact/2) * testImage_std)
- Mark as New
- Bookmark
- Subscribe
- Mute
- Subscribe to RSS Feed
- Permalink
Still some numpy reading to do  ... basically you want to mask the array, returning the values that meet your criteria.
I faked some data to expedite the process. An array of shape(10,10) going from 0 to 99.. pretend that the +/- 1.25 std value levels are represented by 20 and 80 (ie np.std(a) = 1.25... hence... -1.25 and 1.25 are the < and > levels
>>> import numpy as np
>>> a = np.arange(100).reshape(10,10)
>>> xbar = np.mean(a)
>>> stds = [ 20, 80] # pretend these represent the np.std(a) values for -1.25std and 1.25std
>>> m = np.where((a < stds[0]) | (a >stds[1]), a, -1)
>>> m
array([[ 0, 1, 2, 3, 4, 5, 6, 7, 8, 9],
[10, 11, 12, 13, 14, 15, 16, 17, 18, 19],
[-1, -1, -1, -1, -1, -1, -1, -1, -1, -1],
[-1, -1, -1, -1, -1, -1, -1, -1, -1, -1],
[-1, -1, -1, -1, -1, -1, -1, -1, -1, -1],
[-1, -1, -1, -1, -1, -1, -1, -1, -1, -1],
[-1, -1, -1, -1, -1, -1, -1, -1, -1, -1],
[-1, -1, -1, -1, -1, -1, -1, -1, -1, -1],
[-1, 81, 82, 83, 84, 85, 86, 87, 88, 89],
[90, 91, 92, 93, 94, 95, 96, 97, 98, 99]])
>>>Now, I assigned -1 (aka, a nodata value) to the values that were within the +/1.25 range, leaving only those on the tails.
- Mark as New
- Bookmark
- Subscribe
- Mute
- Subscribe to RSS Feed
- Permalink
Thanks Dan. Yes, lots of reading still to do on Numpy. I must be missing something here because it still isn't working properly.
#Set Environment
import arcpy
from arcpy.sa import *
from arcpy import env
import numpy as np
import sys, os, string, glob
import matplotlib.pyplot as plt
arcpy.CheckOutExtension("spatial")
arcpy.env.overwriteOutput = True
#Identify a test raster
testImage = arcpy.Raster(r"F:\GIS_Dev\RCM_VAPs_Validate\0Comparisons\RS2_SQ28_SLC\freeman\reports\gamma_dbl_clip.tif")
#Convert Raster to Numpy Array - raster is 1677 columns x 7155 rows, floating point 32 bit
testImage_arr = arcpy.RasterToNumPyArray(testImage,lowerLeft,1677,7155, nodata_to_value=0)
#Set some variables for stats calculations
sdFact = 2.5
nb_Classes = 20
#Calculate the min, max, mean and standard deviation of the array
testImage_min = np.min(testImage_arr)
testImage_max = np.max(testImage_arr)
testImage_mean = np.mean(testImage_arr)
testImage_std = np.std(testImage_arr)
#Calculate a min and max based on sdFact, mean, and sdev
arr_min = (testImage_mean - (sdFact/2) * testImage_std)
arr_max = (testImage_mean + (sdFact/2) * testImage_std)
arr_range = arr_max - arr_min
print arr_range
stds = [arr_min, arr_max]
print stds
new_Arr = np.where((testImage_arr > stds[0]) | (testImage_arr < stds[1]), testImage_arr, -1)
plt.hist(new_Arr, bins=nb_Classes)
plt.title("Histogram")
plt.xlabel("Value")
plt.ylabel("Count")
plt.grid(True)
plt.show()
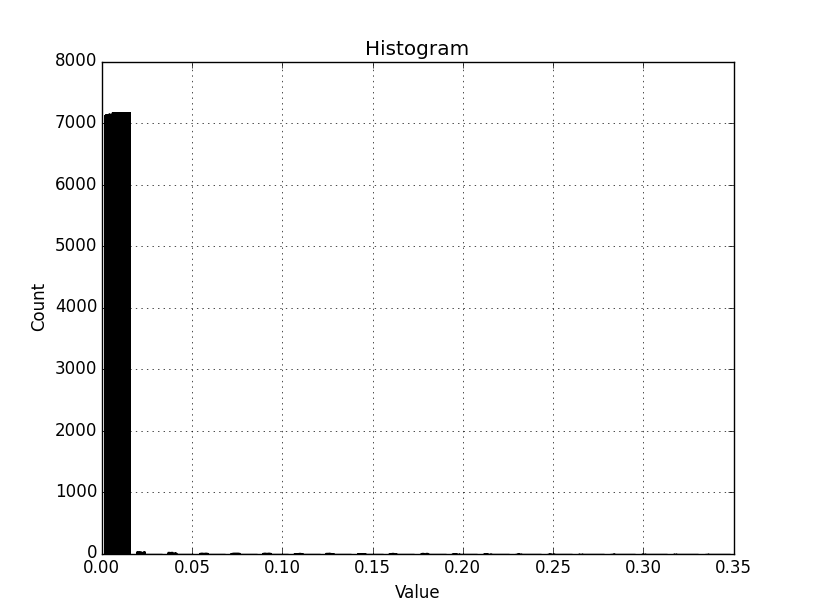
This yields the attached graph, which seems to include all values in the original raster, and not only the masked range. The histogram is compressed to the low end and we want to expose greater detail here by binning the desired range (arr_range = 0.00555599341169) across 20 bins.
For the test raster:
min = 0
max = 0.349763
mean = 8.98602e-05
st dev = 0.0022224
- Mark as New
- Bookmark
- Subscribe
- Mute
- Subscribe to RSS Feed
- Permalink
Look carefully at your < and > placement, you chose everything between rather than at the tails, as in my example
np.where((a < stds[0]) | (a >stds[1]), a, -1)- Mark as New
- Bookmark
- Subscribe
- Mute
- Subscribe to RSS Feed
- Permalink
Sorry, I took that to be like a conditional statement, whereby everything within the brackets would be set to the image values in the array, and everything excluded would be set to -1 (null). In your array you seem to keep the values outside the required range and set everything inside the range to -1. Clearly I had the syntax/logic all wrong. Thanks.
It would help if I read the entire post instead of missing your final sentence. Seems I would want this usage:
new_Arr = np.where((testImage_arr < stds[0]) | (testImage_arr > stds[1]), -1, testImage_arr)
- Mark as New
- Bookmark
- Subscribe
- Mute
- Subscribe to RSS Feed
- Permalink
Consider that these are equal
m = np.where((a < stds[0]) | (a >stds[1]), a, -1)
m2 = np.where( np.logical_or(a<stds[0], a>stds[1]), a, -1)
>>> np.alltrue(m==m2)
Truewhich do you prefer?
- Mark as New
- Bookmark
- Subscribe
- Mute
- Subscribe to RSS Feed
- Permalink
Back again, Dan. I have the attached histogram out now.
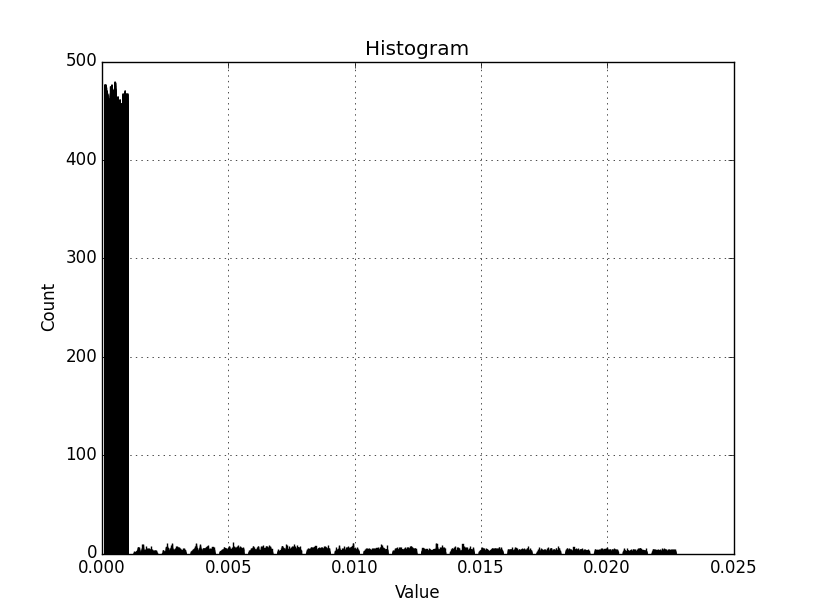
I am working with a smaller AOI/subset of the original raster. I have also delimited the lower bound to the min val in the array, and set the upper bound using a 'where' statement as you have suggested (1.25 st dev * mean). I assume if I set the lower bound to an artificial value with (mean - (1.25 * st dev)) and there are no data values it may create empty bins? I would prefer to have all bins populated. By the looks of the histogram above, it might also be beneficial to have a separate zero-only bin. Not sure if that can be implemented and still retain the other 20 bin ranges.
stds = [arr_min, arr_max]
new_Arr = np.where((testImage_arr < stds[0]) | (testImage_arr > stds[1]), 0, testImage_arr)
Printing the new np.histogram array yields this:
(array([226603, 939, 1265, 1468, 1548, 1474, 1537, 1492,
1463, 1341, 1365, 1291, 1203, 1159, 1079, 1041,
1027, 967, 889, 849]), array([ 0. , 0.00114019, 0.00228038, 0.00342057, 0.00456075,
0.00570094, 0.00684113, 0.00798132, 0.00912151, 0.0102617 ,
0.01140189, 0.01254207, 0.01368226, 0.01482245, 0.01596264,
0.01710283, 0.01824302, 0.0193832 , 0.02052339, 0.02166358,
0.02280377]))
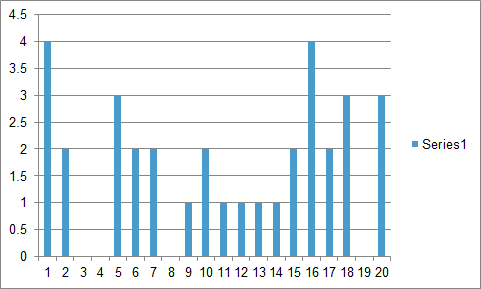
I think this looks pretty good, but I now need to get only the counts out into a new array that I can plot. A final format might look something like this (generated in Excel using random numbers). Is there a simple way to grab the count portion only and convert that to plot as a new histogram? Thanks.