- Home
- :
- All Communities
- :
- Developers
- :
- Python
- :
- Python Questions
- :
- Calculate Correlation and P-value between rasters
- Subscribe to RSS Feed
- Mark Topic as New
- Mark Topic as Read
- Float this Topic for Current User
- Bookmark
- Subscribe
- Mute
- Printer Friendly Page
Calculate Correlation and P-value between rasters
- Mark as New
- Bookmark
- Subscribe
- Mute
- Subscribe to RSS Feed
- Permalink
Hi Xander Bakker I have used this script and got two rasters "correlation" and "pearson". Which one is the P-value?
Branched from https://community.esri.com/thread/200534-re-correlation-between-two-different-rasters
Solved! Go to Solution.
Accepted Solutions
- Mark as New
- Bookmark
- Subscribe
- Mute
- Subscribe to RSS Feed
- Permalink
Hi margarita stevia ,
Could you validate if this works for you? I will create the additional p-value raster and a mask raster containing the pixels with value 1 where the condition (p-value <= 0.05 and positive correlation) is met. The calculation of the p-value is based on the code provided by Dan Patterson
It seems that the resulting areas (blue pixels) are near the rivers . Does that make sense?
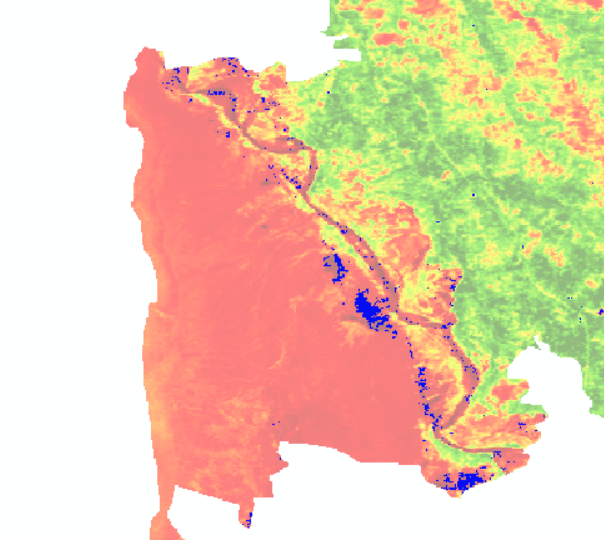
See code below:
def main():
print "load modules..."
import arcpy
arcpy.env.overwriteOutput = True
import numpy as np
template1 = r'C:\GeoNet\Pvalue\Send\NDVI\r{0}_WUE.TIF'
template2 = r'C:\GeoNet\Pvalue\Send\temp\r{0}_TEM.TIF'
nodata = -3.4028235e+38
out_ras_corr = r'C:\GeoNet\Pvalue\Send\Results\correlation_v01.TIF'
out_ras_pear = r'C:\GeoNet\Pvalue\Send\Results\pearson_v01.TIF'
out_ras_pval = r'C:\GeoNet\Pvalue\Send\Results\pvalue_v01.TIF'
out_ras_mask = r'C:\GeoNet\Pvalue\Send\Results\mask_v01.TIF'
# settings
max_pval = 0.05
min_corr = 0
mask_val = 1
no_mask_val = 0
print "create nested numpy array list..."
lst_np_ras = []
for i in range(1, 5):
ras_path1 = template1.format("%03d" % (i,))
print " - ", ras_path1
ras_np1 = arcpy.RasterToNumPyArray(ras_path1)
ras_path2 = template2.format("%03d" % (i,))
print " - ", ras_path2
ras_np2 = arcpy.RasterToNumPyArray(ras_path2)
lst_np_ras.append([ras_np1, ras_np2])
print "read props numpy raster..."
ras_np = lst_np_ras[0][0] # take first numpy array from list
rows = ras_np.shape[0]
cols = ras_np.shape[1]
print " - rows:", rows
print " - cols:", cols
print "create output numpy array..."
ras_path = template1.format("%03d" % (1,))
raster = arcpy.Raster(ras_path)
ras_np_res_corr = np.ndarray((rows, cols))
ras_np_res_pear = np.ndarray((rows, cols))
ras_np_res_pval = np.ndarray((rows, cols))
ras_np_res_mask = np.ndarray((rows, cols))
print " - out rows:", ras_np_res_corr.shape[0]
print " - out cols:", ras_np_res_corr.shape[1]
print "loop through pixels..."
pix_cnt = 0
for row in range(rows):
for col in range(cols):
pix_cnt += 1
if pix_cnt % 5000 == 0:
print " - row:", row, " col:", col, " pixel:", pix_cnt
lst_vals1 = []
lst_vals2 = []
try:
for lst_pars in lst_np_ras:
lst_vals1.append(lst_pars[0][row, col])
lst_vals2.append(lst_pars[1][row, col])
lst_vals1 = ReplaceNoData(lst_vals1, nodata)
lst_vals2 = ReplaceNoData(lst_vals2, nodata)
# perform calculation on list
correlation = CalculateCorrelation(lst_vals1, lst_vals2, nodata)
ras_np_res_corr[row, col] = correlation
pearson = CalculatePearsons(lst_vals1, lst_vals2, nodata)
ras_np_res_pear[row, col] = pearson
pvalue = CalculatePvalue(lst_vals1, lst_vals2, nodata)
ras_np_res_pval[row, col] = pvalue
# compare correlation and p-value
if pvalue == nodata:
mask = nodata
elif (correlation >= min_corr) and (pvalue <= max_pval):
mask = mask_val
else:
mask = no_mask_val
ras_np_res_mask[row, col] = mask
except Exception as e:
print "ERR:", e
print " - row:", row, " col:", col, " pixel:", pix_cnt
print " - lst_vals1:", lst_vals1
print " - lst_vals2:", lst_vals2
pnt = arcpy.Point(raster.extent.XMin, raster.extent.YMin) # - raster.meanCellHeight
xcellsize = raster.meanCellWidth
ycellsize = raster.meanCellHeight
print "Write output rasters..."
print " - ", out_ras_corr
ras_res_corr = arcpy.NumPyArrayToRaster(ras_np_res_corr, lower_left_corner=pnt, x_cell_size=xcellsize,
y_cell_size=ycellsize, value_to_nodata=nodata)
arcpy.CopyRaster_management(ras_res_corr, out_ras_corr)
arcpy.DefineProjection_management(in_dataset=out_ras_corr, coor_system="GEOGCS['GCS_WGS_1984',DATUM['D_WGS_1984',SPHEROID['WGS_1984',6378137.0,298.257223563]],PRIMEM['Greenwich',0.0],UNIT['Degree',0.0174532925199433]]")
print " - ", out_ras_pear
ras_res_pear = arcpy.NumPyArrayToRaster(ras_np_res_pear, lower_left_corner=pnt, x_cell_size=xcellsize,
y_cell_size=ycellsize, value_to_nodata=nodata)
arcpy.CopyRaster_management(ras_res_pear, out_ras_pear)
arcpy.DefineProjection_management(in_dataset=out_ras_pear, coor_system="GEOGCS['GCS_WGS_1984',DATUM['D_WGS_1984',SPHEROID['WGS_1984',6378137.0,298.257223563]],PRIMEM['Greenwich',0.0],UNIT['Degree',0.0174532925199433]]")
print " - ", out_ras_pval
ras_res_pval = arcpy.NumPyArrayToRaster(ras_np_res_pval, lower_left_corner=pnt, x_cell_size=xcellsize,
y_cell_size=ycellsize, value_to_nodata=nodata)
arcpy.CopyRaster_management(ras_res_pval, out_ras_pval)
arcpy.DefineProjection_management(in_dataset=out_ras_pval, coor_system="GEOGCS['GCS_WGS_1984',DATUM['D_WGS_1984',SPHEROID['WGS_1984',6378137.0,298.257223563]],PRIMEM['Greenwich',0.0],UNIT['Degree',0.0174532925199433]]")
print " - ", out_ras_mask
ras_res_mask = arcpy.NumPyArrayToRaster(ras_np_res_mask, lower_left_corner=pnt, x_cell_size=xcellsize,
y_cell_size=ycellsize, value_to_nodata=nodata)
arcpy.CopyRaster_management(ras_res_mask, out_ras_mask)
arcpy.DefineProjection_management(in_dataset=out_ras_mask, coor_system="GEOGCS['GCS_WGS_1984',DATUM['D_WGS_1984',SPHEROID['WGS_1984',6378137.0,298.257223563]],PRIMEM['Greenwich',0.0],UNIT['Degree',0.0174532925199433]]")
def CalculateCorrelation(a, b, nodata):
import numpy
try:
coef = numpy.corrcoef(a,b)
return coef[0][1]
except:
return nodata
def ReplaceNoData(lst, nodata):
res = []
for a in lst:
if a < nodata / 2.0:
res.append(None)
else:
res.append(a)
return res
def CalculatePearsons(a, b, nodata):
import numpy as np
from scipy.stats import pearsonr
try:
x = np.array(a)
y = np.array(b)
r, p = pearsonr(a, y)
return p
except:
return nodata
def CalculatePvalue(a, b, nodata):
import numpy as np
from scipy.stats import stats
try:
x = np.array(a)
y = np.array(b)
r, p_val = stats.pearsonr(x, y)
return p_val
except:
return nodata
if __name__ == '__main__':
main()- Mark as New
- Bookmark
- Subscribe
- Mute
- Subscribe to RSS Feed
- Permalink
Neither, p-value is a measure of the strength of the correlation coefficient calculated from sample size and the measured 'r' and a sampling distribution
scipy.stats.pearsonr — SciPy v1.3.0 Reference Guide
example for variants of simple arrays, using this
from scipy import stats
a = np.arange(9)
b = np.arange(9, 0, -1)
c = np.array([9, 7, 8, 6, 5, 4, 3, 2, 1]) # ---- like b, but 2 numbers switched
r, p_val = stats.pearsonr(a, b) # ---- perfect inverse, r = -1, p = 0.0000
r, p_val
(-1.0, 0.0)
r, p_val = stats.pearsonr(a, c)
r, p_val
(-0.9833333333333333, 1.936196303745927e-06)- Mark as New
- Bookmark
- Subscribe
- Mute
- Subscribe to RSS Feed
- Permalink
I want to extract the pixels where correlation is positive and p-value is < 0.05 How i can do that? How i can estimate P as a raster?
- Mark as New
- Bookmark
- Subscribe
- Mute
- Subscribe to RSS Feed
- Permalink
Hi Xander Bakker please help me with how i can extract correlation values at 0.05 significance level. I'm running out of time.
- Mark as New
- Bookmark
- Subscribe
- Mute
- Subscribe to RSS Feed
- Permalink
Can you share a sample of your data and the script you have so far?
- Mark as New
- Bookmark
- Subscribe
- Mute
- Subscribe to RSS Feed
- Permalink
Hi margarita stevia ,
Could you validate if this works for you? I will create the additional p-value raster and a mask raster containing the pixels with value 1 where the condition (p-value <= 0.05 and positive correlation) is met. The calculation of the p-value is based on the code provided by Dan Patterson
It seems that the resulting areas (blue pixels) are near the rivers . Does that make sense?
See code below:
def main():
print "load modules..."
import arcpy
arcpy.env.overwriteOutput = True
import numpy as np
template1 = r'C:\GeoNet\Pvalue\Send\NDVI\r{0}_WUE.TIF'
template2 = r'C:\GeoNet\Pvalue\Send\temp\r{0}_TEM.TIF'
nodata = -3.4028235e+38
out_ras_corr = r'C:\GeoNet\Pvalue\Send\Results\correlation_v01.TIF'
out_ras_pear = r'C:\GeoNet\Pvalue\Send\Results\pearson_v01.TIF'
out_ras_pval = r'C:\GeoNet\Pvalue\Send\Results\pvalue_v01.TIF'
out_ras_mask = r'C:\GeoNet\Pvalue\Send\Results\mask_v01.TIF'
# settings
max_pval = 0.05
min_corr = 0
mask_val = 1
no_mask_val = 0
print "create nested numpy array list..."
lst_np_ras = []
for i in range(1, 5):
ras_path1 = template1.format("%03d" % (i,))
print " - ", ras_path1
ras_np1 = arcpy.RasterToNumPyArray(ras_path1)
ras_path2 = template2.format("%03d" % (i,))
print " - ", ras_path2
ras_np2 = arcpy.RasterToNumPyArray(ras_path2)
lst_np_ras.append([ras_np1, ras_np2])
print "read props numpy raster..."
ras_np = lst_np_ras[0][0] # take first numpy array from list
rows = ras_np.shape[0]
cols = ras_np.shape[1]
print " - rows:", rows
print " - cols:", cols
print "create output numpy array..."
ras_path = template1.format("%03d" % (1,))
raster = arcpy.Raster(ras_path)
ras_np_res_corr = np.ndarray((rows, cols))
ras_np_res_pear = np.ndarray((rows, cols))
ras_np_res_pval = np.ndarray((rows, cols))
ras_np_res_mask = np.ndarray((rows, cols))
print " - out rows:", ras_np_res_corr.shape[0]
print " - out cols:", ras_np_res_corr.shape[1]
print "loop through pixels..."
pix_cnt = 0
for row in range(rows):
for col in range(cols):
pix_cnt += 1
if pix_cnt % 5000 == 0:
print " - row:", row, " col:", col, " pixel:", pix_cnt
lst_vals1 = []
lst_vals2 = []
try:
for lst_pars in lst_np_ras:
lst_vals1.append(lst_pars[0][row, col])
lst_vals2.append(lst_pars[1][row, col])
lst_vals1 = ReplaceNoData(lst_vals1, nodata)
lst_vals2 = ReplaceNoData(lst_vals2, nodata)
# perform calculation on list
correlation = CalculateCorrelation(lst_vals1, lst_vals2, nodata)
ras_np_res_corr[row, col] = correlation
pearson = CalculatePearsons(lst_vals1, lst_vals2, nodata)
ras_np_res_pear[row, col] = pearson
pvalue = CalculatePvalue(lst_vals1, lst_vals2, nodata)
ras_np_res_pval[row, col] = pvalue
# compare correlation and p-value
if pvalue == nodata:
mask = nodata
elif (correlation >= min_corr) and (pvalue <= max_pval):
mask = mask_val
else:
mask = no_mask_val
ras_np_res_mask[row, col] = mask
except Exception as e:
print "ERR:", e
print " - row:", row, " col:", col, " pixel:", pix_cnt
print " - lst_vals1:", lst_vals1
print " - lst_vals2:", lst_vals2
pnt = arcpy.Point(raster.extent.XMin, raster.extent.YMin) # - raster.meanCellHeight
xcellsize = raster.meanCellWidth
ycellsize = raster.meanCellHeight
print "Write output rasters..."
print " - ", out_ras_corr
ras_res_corr = arcpy.NumPyArrayToRaster(ras_np_res_corr, lower_left_corner=pnt, x_cell_size=xcellsize,
y_cell_size=ycellsize, value_to_nodata=nodata)
arcpy.CopyRaster_management(ras_res_corr, out_ras_corr)
arcpy.DefineProjection_management(in_dataset=out_ras_corr, coor_system="GEOGCS['GCS_WGS_1984',DATUM['D_WGS_1984',SPHEROID['WGS_1984',6378137.0,298.257223563]],PRIMEM['Greenwich',0.0],UNIT['Degree',0.0174532925199433]]")
print " - ", out_ras_pear
ras_res_pear = arcpy.NumPyArrayToRaster(ras_np_res_pear, lower_left_corner=pnt, x_cell_size=xcellsize,
y_cell_size=ycellsize, value_to_nodata=nodata)
arcpy.CopyRaster_management(ras_res_pear, out_ras_pear)
arcpy.DefineProjection_management(in_dataset=out_ras_pear, coor_system="GEOGCS['GCS_WGS_1984',DATUM['D_WGS_1984',SPHEROID['WGS_1984',6378137.0,298.257223563]],PRIMEM['Greenwich',0.0],UNIT['Degree',0.0174532925199433]]")
print " - ", out_ras_pval
ras_res_pval = arcpy.NumPyArrayToRaster(ras_np_res_pval, lower_left_corner=pnt, x_cell_size=xcellsize,
y_cell_size=ycellsize, value_to_nodata=nodata)
arcpy.CopyRaster_management(ras_res_pval, out_ras_pval)
arcpy.DefineProjection_management(in_dataset=out_ras_pval, coor_system="GEOGCS['GCS_WGS_1984',DATUM['D_WGS_1984',SPHEROID['WGS_1984',6378137.0,298.257223563]],PRIMEM['Greenwich',0.0],UNIT['Degree',0.0174532925199433]]")
print " - ", out_ras_mask
ras_res_mask = arcpy.NumPyArrayToRaster(ras_np_res_mask, lower_left_corner=pnt, x_cell_size=xcellsize,
y_cell_size=ycellsize, value_to_nodata=nodata)
arcpy.CopyRaster_management(ras_res_mask, out_ras_mask)
arcpy.DefineProjection_management(in_dataset=out_ras_mask, coor_system="GEOGCS['GCS_WGS_1984',DATUM['D_WGS_1984',SPHEROID['WGS_1984',6378137.0,298.257223563]],PRIMEM['Greenwich',0.0],UNIT['Degree',0.0174532925199433]]")
def CalculateCorrelation(a, b, nodata):
import numpy
try:
coef = numpy.corrcoef(a,b)
return coef[0][1]
except:
return nodata
def ReplaceNoData(lst, nodata):
res = []
for a in lst:
if a < nodata / 2.0:
res.append(None)
else:
res.append(a)
return res
def CalculatePearsons(a, b, nodata):
import numpy as np
from scipy.stats import pearsonr
try:
x = np.array(a)
y = np.array(b)
r, p = pearsonr(a, y)
return p
except:
return nodata
def CalculatePvalue(a, b, nodata):
import numpy as np
from scipy.stats import stats
try:
x = np.array(a)
y = np.array(b)
r, p_val = stats.pearsonr(x, y)
return p_val
except:
return nodata
if __name__ == '__main__':
main()- Mark as New
- Bookmark
- Subscribe
- Mute
- Subscribe to RSS Feed
- Permalink
print("Thank you")
Thank you Sir Xander Bakker. I'm vary thankful to you for your kind response. The script is running perfectly. Yes the pixels are near the river. 
- Mark as New
- Bookmark
- Subscribe
- Mute
- Subscribe to RSS Feed
- Permalink
Hi margaritastevia ,
Glad to hear that the script is producing the expected results. Good luck with you investigation!
- Mark as New
- Bookmark
- Subscribe
- Mute
- Subscribe to RSS Feed
- Permalink
Hi Xander Bakker,
Glad to get the script of the correlation and P-value between rasters, but now I only have two rasters(ndvi and occurence of flooding). I can't solve my question using the script above. I need calculate the correlation and p-value between two rasters not sets of rasters.Xander BakkerCalculate Correlation and P-value between rasters#My data is attached, need your help.
Best wishes