Turn on suggestions
Auto-suggest helps you quickly narrow down your search results by suggesting possible matches as you type.
Cancel
- Home
- :
- All Communities
- :
- Developers
- :
- Python
- :
- Python Questions
- :
- arcpy charts, setting the class break values?
Options
- Subscribe to RSS Feed
- Mark Topic as New
- Mark Topic as Read
- Float this Topic for Current User
- Bookmark
- Subscribe
- Mute
- Printer Friendly Page
03-29-2021
10:39 PM
- Mark as New
- Bookmark
- Subscribe
- Mute
- Subscribe to RSS Feed
- Permalink
Hi All
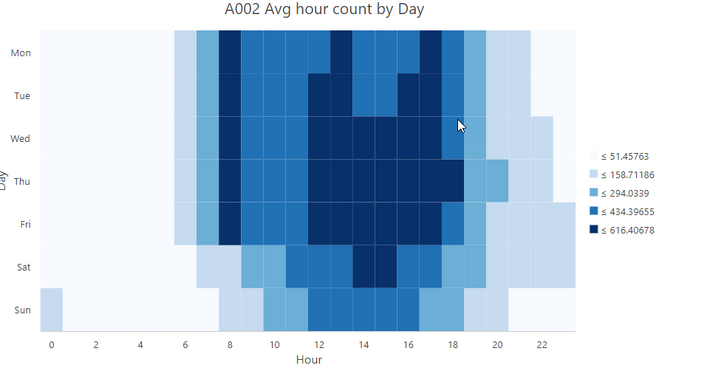
I have a script that loops though a dataframe, runs a query and exports each subset to a feature table. Then i use arcpy.chart to generate calendar heat charts. I have set the classification method to 'natural breaks' but that gives be classes with heaps of decimals (see attached). Is there anyway to round the class breaks? I am exporting them to svg's so I guess I could do some sort of replace, but just wondering if there is an easier method?
Solved! Go to Solution.
1 Solution
Accepted Solutions
03-30-2021
06:27 PM
- Mark as New
- Bookmark
- Subscribe
- Mute
- Subscribe to RSS Feed
- Permalink
Ok, I played around with it and the best solution could come up with was to:
- Read the svg
- Find the legend values by searching child nodes that contain '≤'
- Creating a list of legend values
- Creating a new list to round the legend values
- Modifying the original list (step 3) to re-insert a thousand separator ','
- String replace on the svg file
doc = xml.dom.minidom.parse(r"O:\users\pmilenkovic\PythonScripts\NotebookSandbox"  +os.sep + loc +'d_daily.svg')

    name = doc.getElementsByTagName('text')

    leg_lab=[]
    dec_pos = []
    for tx in name:
        if re.search('≤',str(tx.childNodes)):
            tx.normalize()

            leg_lab.append(str(tx.firstChild.data).replace(',','').replace('≤','').strip())


    leg_lab_replace = []
    for ll in leg_lab:
        leg_lab_replace.append(round(float(ll)))


    leg_lab_to_replace = []
    for ll in leg_lab:
        if ll.find('.') == 4:
            leg_lab_to_replace.append(ll[:1]+','+ll[1:])
        elif ll.find('.') == 5:
            leg_lab_to_replace.append(ll[:2]+','+ll[2:])
        else:
            leg_lab_to_replace.append(ll)


    #input file
    fin = open(r"O:\users\pmilenkovic\PythonScripts\NotebookSandbox" +os.sep + loc +'d_daily.svg', "rt")
    #output file to write the result to
    data = fin.read()
    for ll, nll in zip(leg_lab_to_replace,leg_lab_replace):

        data = data.replace(str(ll),str(nll))
    fin = open(r"O:\users\pmilenkovic\PythonScripts\NotebookSandbox" +os.sep + loc +'d_daily.svg', "wt")

    fin.write(data)
    #close input and output files
    fin.close()
1 Reply
03-30-2021
06:27 PM
- Mark as New
- Bookmark
- Subscribe
- Mute
- Subscribe to RSS Feed
- Permalink
Ok, I played around with it and the best solution could come up with was to:
- Read the svg
- Find the legend values by searching child nodes that contain '≤'
- Creating a list of legend values
- Creating a new list to round the legend values
- Modifying the original list (step 3) to re-insert a thousand separator ','
- String replace on the svg file
doc = xml.dom.minidom.parse(r"O:\users\pmilenkovic\PythonScripts\NotebookSandbox"  +os.sep + loc +'d_daily.svg')

    name = doc.getElementsByTagName('text')

    leg_lab=[]
    dec_pos = []
    for tx in name:
        if re.search('≤',str(tx.childNodes)):
            tx.normalize()

            leg_lab.append(str(tx.firstChild.data).replace(',','').replace('≤','').strip())


    leg_lab_replace = []
    for ll in leg_lab:
        leg_lab_replace.append(round(float(ll)))


    leg_lab_to_replace = []
    for ll in leg_lab:
        if ll.find('.') == 4:
            leg_lab_to_replace.append(ll[:1]+','+ll[1:])
        elif ll.find('.') == 5:
            leg_lab_to_replace.append(ll[:2]+','+ll[2:])
        else:
            leg_lab_to_replace.append(ll)


    #input file
    fin = open(r"O:\users\pmilenkovic\PythonScripts\NotebookSandbox" +os.sep + loc +'d_daily.svg', "rt")
    #output file to write the result to
    data = fin.read()
    for ll, nll in zip(leg_lab_to_replace,leg_lab_replace):

        data = data.replace(str(ll),str(nll))
    fin = open(r"O:\users\pmilenkovic\PythonScripts\NotebookSandbox" +os.sep + loc +'d_daily.svg', "wt")

    fin.write(data)
    #close input and output files
    fin.close()
