Public Safety Blog

cancel
Showing results for 
Show  only  | Search instead for 
Did you mean: 

Other Boards in This Place


Latest Activity

(65 Posts)
BrendaMartinez
Esri Regular Contributor

 By Mike King

Director, Emergency Communications Solutions – Esri


I’m pleased to announce the release of several public safety solutions by Esri. These solutions are built for first responders and public safety personnel. Some of them are included with the new release of ArcGIS Pro 2.5 and anyone who works with GIS technology should give them careful consideration. 


For example, the new Address Data Management solution is a configuration of ArcGIS Pro that can be used by mapping technicians to maintain an inventory of road center-lines, valid road names, site addresses, and related mailing addresses. It comes after many months of hard work and includes recommendations from the National Emergency Number Association (NENA) and the U.S. Postal Service. This solution gives database managers step-by-step instructions and sample data to help them in transitioning older databases to this newly updated format. You can learn more about this updated solution by watching our webinar titled, “GIS Focus for PSAPs in 2020.”


To compliment this free offering, the Address Field Operations solution provides Esri license holders a collection of maps and apps that can be used to crowd-source missing address information, manage address field operations, and collect address information while in the field.

As we continue our focus on migrating 2D data to 3D, our emphasis turns to visualizing z-axis information (elevation) on maps, mobile data terminals, smartphones, dispatch screens and command/control center video walls.

The Local Government 3D Basemaps provide tools and workflows to add an extract building footprint which uses LIDAR to create building footprints and shows ground and building class codes when creating elevation surfaces, shows roof slopes, vegetation and other components.


Emergency managers can benefit from the Flood Impact Analysis solution, a configuration of ArcGIS Pro that can be used to develop flooding scenarios and visualize the impact of flooding. The Road Network Data Management solution provides a configuration that can be used to maintain an inventory of public roads, road intersections, and physical road characteristics (such as speed limit, functional class, lane width, and number of lanes). Finally the Transit Safety solution, a collection of maps and apps that can be used by transit safety staff to document safety issues and manage corrective actions or mitigation activities.


I’m excited about the enhancement that have been made to the Crime Analysis Toolbar solution which organizes existing tools for crime analysis workflows. It provides several new tools that support data management, tactical and strategic analysis, investigative analysis, and information sharing needs.


In closing, I would like to mention this new enhancement for firefighters, the Target Hazard Analysis solution which can be used to identify properties and buildings that could result in a loss of life, or have a negative impact on the community if a fire were to occur.


I encourage you to look these over and see if they can help you in your public safety mission. You can learn more about Esri and Public Safety or email me at: mking@esri.com.

more
0 0 3,454
BrendaMartinez
Esri Regular Contributor

by Mike Cox, Director of Fire & EMS Solutions

Responders make critical decisions based on limited information every day. Agencies should strive to generate verified data for emergency response to provide that responder with the right data at the right time. Fire and EMS departments can integrate disparate data from multiple sources that can be used to perform incident assessments, monitor response actions, and to provide a higher level of responder safety based on verifiable intelligence.

Fire and EMS agencies need tools to adapt to fluid risks and to support a variety of mission requirements. Today, we must be able to identify changing incident conditions, collaborate and unify operations in an all hazard environment, rapidly respond to events, communicate with the public, and analyze the success of those efforts. Through the power of geospatial technology, organizations can now adopt a smarter, more integrative approach to emergency response.

The ever-present threat of terrorist activity and complex day to day operations regularly challenge the Fire Department of New York (FDNY). The FDNY continually seeks technology and methods to increase the impact of their response to significant incidents.

Esri Public Safety personnel and our partner Leica Geosystems were deployed to a full-scale exercise with the Fire Department of New York’s Incident Management Team (IMT). A simulated improvised explosive device devastates a Brooklyn subway tunnel during a weekday morning commute. As units are responding to that incident, a large vessel in Jamaica Bay suffers an explosion, sending multiple patients into the water.

The exercise was designed to evaluate the ability of the FDNY Special Operations Command (SOC) to manage the response to two separate simulated incidents involving rescue operations and wide area search without impacting day to day operations. The exercise involved several hundred responders.

The objectives of the FDNY’s IMT during the evaluation of LIDAR and GIS technology included:

  • To leverage technology to support the SOC response
  • Create products including Dashboards, Collector, and digital mapping applications in support of the exercise 
  • Provide real time data collection using mobile applications
  • To collect, process and view LIDAR data from the Leica platform
  • To process data collected by UAS using Esri Drone2Map software 
  • To share the data collected using the IMT Esri ArcGIS Online organization to give the Incident Commanders the information they need to manage the incident

Incident Operations

The incident map was created using multiple data sources including parcel layer data, road networks, 3D building models, and subway maps. The integration of this data allowed for a comprehensive assessment by command officers and operations personnel.

Real time data collection was performed during the initial response by operational personnel. Esri’s Collector application provided incident intelligence related to victim counts, damage assessment, and the area of operations.

Rapid Processing of LIDAR Data

Leica Geosystems provided two products that perform LIDAR modeling. One was deployed from fixed points throughout the operational area. The second was a backpack based model that personnel could “walk through” the incident area on a mobile device.

This data, creating a 3D model of the tunnel in near total darkness, could provide the command staff the ability to virtually fly through the tunnel within minutes of gathering the data. The LIDAR model identified areas of damage, vehicles, and victim locations.

The LIDAR data was shared through the IMT’s AGOL organization. This allowed the incident data to be accessed by any stakeholder that the command staff deemed appropriate.

UAS Data

FDNY UAS operators were able to provide imagery during the event. This imagery was integrated into the common operating picture. This provided responders with the most up to date site information possible.

The integration of all relevant data to produce a comprehensive picture of the incident was well received by the command staff.  The FDNY has multiple operations personnel heavily engaged in the use of GIS products to improve safety and efficiencies in response operations. The FDNY has developed the capability to use mobile applications for field data collection. Operational personnel not directly involved in the use of GIS recognized its value during this operation. There was demonstrated capability in the IMT’s ability to use mobile applications and build Operations Dashboards to provide a common operating picture. The IMT GIS personnel are highly skilled in the use of GIS for emergency response.


Public safety agencies worldwide already have access to many of the capabilities used during this exercise. These capabilities are applicable to daily operations, disaster response, planning activities, and many other areas of public safety agency operations.

If you have any questions about deploying these capabilities for your agency, please feel free to contact Esri.

Mike Cox, Director of Fire & EMS Solutions  mike_cox@esri.com

more
0 0 2,313
BrendaMartinez
Esri Regular Contributor

Check out the latest blog from Mike Cox on Swiftwater Rescue Mission Improves Using Augmented Reality featuring Johns Creek, Georgia.

Key Takeaways

  • Augmented reality helps orient the user in challenging and disorienting conditions.
  • Crafting a successful solution involves an understanding of objectives and operational conditions.
  • Creative combinations of technology helped solve compounding challenges.

more
0 0 1,186
by Anonymous User
Not applicable

By Mike King, Director of Emergency Communications – Esri

Twitter @printcop

In July of this year, public safety professionals from around the world descended on San Diego, California to attend Esri’s 4-day National Security and Public Safety Summit. Over 700 commanders and staff came together to share the challenges and successes they’ve had while protecting over the past year.
 
As the conference began, I stood in awe, hand over heart, as the flag of the United States was presented. I listened intently as our national anthem was powerfully sung.  I felt a sense of gratitude at the reverence displayed by our many international colleagues and government leaders in attendance.
 
During a “moment of silence” for those who had lost their lives in the line of duty last year, my mind raced back to personal friends who died in the line of duty. Their deaths and the accompanying heartache felt by comrades and loved ones suddenly raced back and I found myself stirred with deep emotion. I could see the faces of many of the attendees, and they too seemed to be humbly honoring those great heroes from around the world.
 
Once the summit was underway, I saw police officers, firefighters and emergency managers sitting side-by-side, interacting with each other, both during and in-between sessions. Their common mission of public protection powerfully eliminated preconceived misconceptions and personal biases. Together, they were learning from each other, embracing commonalities and solving problems.
 
I marveled at the great work being done globally, like the work of the Lebanese Red Cross who adopted a new GIS strategy to improve ambulance response times.  These efforts are now saving lives and our colleagues in Lebanon are leveraging that investment to improve their mobile web applications for improved data collection and information sharing.

Lebanese RedCross at Esri
 
The summit provided examples of real-world, national security and public safety challenges, like those shared by CEO Brian Fontes of NENA, the National Emergency Number Association. Fontes shared NENA’s newly created national PSAP Registry portal, designed to spatially show all public safety answering points (command & control centers). The Registry will support many of the next generation call-taking efforts.

CEO Brian Fontes of NENA at Esri


Other presentations included how U.S. Customs and Border Protection is saving lives through the Missing Migrant Program. This program was designed to save lives along the 4,200 square miles of the Rio Grande Valley and evidence shows that it’s working. 

US Border Patrol

Richard Reed of the FirstNet Authority shared how GIS is used in the rollout of the
first voice and data broadband network dedicated to first-responders and Colonel Volker Kozok showed how the German Armed Forces are using GIS to combat hybrid warfare.
German Armed Forces

 
At one point, I found myself smiling as I reflected on what I was witnessing. It was a true “coming together” of several life-saving disciplines and it included all of the fun-loving banter that exists between first-responders.

 
My personal example goes like this (and sounds like a broken record) as several old firefighter friends approached me with the same humor I’ve heard for 40 years, saying, “Hey King, if you could have scored two more points on your public safety exam, you could have been a fireman too!”  Not to be outdone, and in true form to my law enforcement brotherhood, I simply responded with some of the many reasons why law enforcement is a more noble career, and why we always won the town celebration tug-o’-wars – not just by brawn… but also our brilliance!

Mike King and John Beck at Esri
 
The National Security and Public Safety Summit offered everyone in attendance with a unique balance between visionary leader keynotes, forward-thinking presentations and networking opportunities where attendees could learn about the rapid advances that are occurring globally, including how GIS is influencing and empowering first-responders. Let's continue the conversation in this GeoNet discussion, h
ow will you work to build resilience and collaborate in the new normal?


We want to thank our generous sponsors of the summit which include our gold sponsors: GeoComm, Juvare, Microsoft, and RapidDeploy; and our silver sponsors: BCS, FirstNet, HERE Technologies, and IBM.  If you missed this year’s summit, we will release the proceedings in the coming weeks. Please plan to join us next year at the National Security and Public Safety Summit on July 11-14, 2020 in San Diego. Those registered can also attend the first two days of the Esri International User Conference where more than 19,000 professionals from around the world come together. 


more
0 0 1,800
BrendaMartinez
Esri Regular Contributor

Check out the latest blog from Mike Cox, Director of Fire and EMS Industry Solutions, Esri

https://www.esri.com/about/newsroom/blog/real-time-feeds-ensures-rose-parade-safety/ 


The City of Pasadena has long used maps to communicate details about the parade route, but this is the first time the map went beyond a paper handout. Integrating parade route details within a GIS made real-time tracking to inform public safety response possible.

Key Takeaways

  • Pasadena Fire Department monitors real-time data of weather, floats, and staff.
  • Parade safety assured with better coordination of personnel.
  • After weather threatens event, New Year’s Day tradition continues without disruption.

Read the full blog post here - https://www.esri.com/about/newsroom/blog/real-time-feeds-ensures-rose-parade-safety/ 

more
0 0 812
BrendaMartinez
Esri Regular Contributor

By Mike Cox, Esri Fire and EMS Industry Manager

Responders make critical decisions based on limited information every day. Agencies should strive to generate verified data for emergency and nonemergency needs to provide responders with the right data at the right time. Fire and emergency medical services (EMS) departments generate a large amount of data that can be used to identify emerging threats, monitor performance measures, and develop resource deployment models based on verifiable intelligence.

Modern challenges require modern solutions. Agencies and organizations need tools and operational capabilities to adapt to fluid risks and to support a variety of mission requirements. Today, we must be able to identify threats, collaborate and unify operations, respond rapidly to events, communicate with the public, and analyze the success of those efforts. Through the power of geospatial technology, organizations can now adopt a smarter, more integrative approach to safety and security. With the right technology, data, people, and processes, every community can become a safe community.

The demands on agencies—ranging from aging populations to the increasing severity and frequency of the events to which we must respond—are becoming greater. The role of public safety is changing as we strive to keep our communities livable. The health of a community depends on the effective operation of its public safety agencies, and geographic information system (GIS) technology can improve that effectiveness.

We can use GIS to analyze and measure data and share it with decision-makers. This data can come from computer-aided dispatch (CAD) software, records management systems (RMS), community risk reduction (CRR) activities, or nearly any data source that's deemed appropriate by the agency.

The issue in public safety is to determine how we use this data. How do we visualize it? How do we communicate it? Problems arise because the data can be incorrectly collected. Software changes, proprietary vendor policies, and agency guidelines can obstruct the use of data. Software can be complicated, and visualization can be cumbersome. These problems can disrupt the use of the data by leaders.

GIS can help users overcome these obstacles. Agencies can develop plans and processes for collecting, measuring, and analyzing pertinent data to support their operations.

There is often a communication gap between fire service leadership and GIS personnel. Of course, we are all searching for safe solutions for our customers and public safety personnel. We must bridge the gap between data and where it can be used to make good decisions.

GIS is the tool to bridge that gap. GIS directly impacts how well we collect, measure, and analyze data and supports the credibility of leaders and the organization. Using data analysis and communicating its results to your personnel, elected officials, and the public can impact the long-term health of your organization. The ability to tell the organization's story will affect staffing, fleets, station construction, and fiscal decisions.

The accreditation process is a perfect example of the appropriate use of data. As defined by the Center for Public Safety Excellence (CPSE), accreditation is "an all-hazard, quality improvement model based on risk analysis and self-assessment that promotes the establishment of community-adopted performance targets for fire and emergency service agencies." This model of continual improvement depends heavily on the collection and analysis of data.

Public safety personnel are continually analyzing data. Every response generates data for after-action reports, performance measures, and the identification of successful outcomes. These reviews can be supported using GIS. The benefits of using GIS data to measure performance and focus resources can be wide-ranging. These benefits include the following:

  • Identification of populations at risk—A community risk assessment (CRA), performed for the accreditation process and for risk reduction programs, can identify high-risk occupancies (target hazards), at-risk populations, and areas of the community where there should be public education and prevention programs.
  • Increased responder safety—Through a CRA, preplanning efforts can be focused on the highest-risk occupancies. Responders can identify these hazards before the response. GIS allows agencies to use a visual product to share these assessments efficiently with anyone deemed appropriate. These plans can be communicated in near real time as they are generated or updated.
  • Support for the budgetary process—Gone are the days of anecdotal presentations to justify expenditures. Elected officials and the community no longer want decisions based on gut feelings. With GIS, data can be presented in a way that easily identifies gaps in service delivery, local at-risk areas, and the impact of growth on a community. These stories can be communicated to elected leaders to justify the investment of public funding in the agency.

To effectively analyze data, your agency must do three things:

  • Identify what decisions must be made and ensure that your agency's data supports these decisions. This data can include tax parcel, road network, demographic, RMS, CAD, and CRR information. Consider what data the agency would want in a visual product that would help staff make decisions. RMS and CAD data is typically easily consumed by GIS to generate visual products.
  • Use available off-the-shelf solutions to analyze data by location, time, and performance. Is the agency meeting effective response force (ERF) objectives? What areas of the community have service delivery gaps?
  • Visualize the information and share it with the appropriate decision-makers. Agencies will be able to determine if the department is meeting performance objectives. Decision-makers can determine where these performance gaps are so that resources can be appropriately deployed.

The accreditation process requires the use of planning zones, which can be easily designated as the agency prefers. These zones can be created in geographic measurements, such as a square mile; by first-due responders' or other individuals' resource areas of responsibility; or—using the most comprehensive approach, after performing a focused risk assessment—at a very granular address point for every occupancy in a jurisdiction.

We need a CRA to understand the community we serve. These assessments not only identify risk but also highlight the characteristics of the population and infrastructure that impact response daily. The data available for the CRA is from the agency and outside sources. This data can include demographics, occupancy types, water systems, target hazards, floodplains, and critical infrastructure that can be identified and presented with GIS. Your agency can use this assessment to focus efforts on continual improvement and reduce the risk for your community, and then use GIS to efficiently manage that risk reduction effort.

Drive-time analysis, 90th percentile data visualization, and the presentation of high-risk areas can all be performed with GIS. Off-the-shelf templates support the agency's data analysis. Use templates for direction on how to automate the data you import into your solutions. These solutions are configurable and very flexible. You decide what data is used, how to view it, and who can access it.

Visit: solutions.arcgis.com/local-government/fire-service/

Now this data can help your agency become more efficient and reduce risk for responders and the community. These solutions are not complicated and provide the appropriate tools to decision-makers, from frontline personnel to the agency executives. These solutions provide leaders with the tools for making decisions to increase responder safety, reduce response times, and provide an environment of continual improvement.

References

Esri: esri.com

CPSE: https://cpse.org/

Vision 20/20: http://www.strategicfire.org

Orland Fire Protection District: www.orlandfire.org

Orland Fire GIS: Steve Rivero, Engineer s.rivero@orlandfire.org

Esri: Mike Cox, Fire and EMS Industry Manager Mike_Cox@esri.com

more
2 0 2,722
BrendaMartinez
Esri Regular Contributor

Early September historically sees the most disaster damage in the US, because it’s the height of the hurricane season in the Atlantic Basin. In time for this busy season, FEMA has released Preliminary Damage Assessment (PDA) templates for Survey123 for ArcGIS. The templates streamline data collection on handheld devices and mark an ongoing digital transformation from traditional paper forms.


A PDA report is mandated by Congress in order to determine if disaster damages warrant a presidential major disaster declaration and the funds that come with it. The templates address one of the primary goals of FEMA’s new strategic plan—to reduce complexity—making it easier and quicker for communities and individuals to receive the assistance they need.


“We designed the survey to be easy for anyone to fill out,” said Erin Densford, Recovery Operations Officer, FEMA headquarters. “We know that state, local, tribal and territorial governments sometimes have to rely on people that have never done a damage assessment before, and the language on the survey is meant to be very straightforward.”


The PDA process starts at the local level where damage details are initially collected, shared, and validated by State, Tribal, and Territorial authorities. These entities generally have 30 days from the start of an incident to determine whether or not federal assistance in the form of FEMA Individual Assistance, Public Assistance or other federal programs may be necessary.


Many local authorities thankfully face disasters for the first time or go decades between events. For those new to the process or refreshing their understanding, the process is well-documented in a detailed manual. However, the level of detail is hard to process in the immediate aftermath of a disaster event.


“With the templates, you can look at the data schema and have a good sense of what we want within five or ten minutes,” Densford said. “It’s far faster than looking through the 60-page manual, which users can reference for clarification.”


The template approach has been in the works for some time. It has been tested in pilot programs with state and local authorities. Refinements have reached the point where it’s ready to be shared broadly with the emergency management community.


This process isn’t a great leap forward in time savings for individual assessments, but it greatly improves accuracy and overall reporting. In testing, it takes a bit more time than paper because the step-by-step form-based approach requires that each field be filled out for each assessment.  With this template approach, “We’re getting all the pieces of information that we hope to collect, whereas we had gaps in the paper-based process in the past,” Densford said.


This improved accuracy also relates to improved location details.


“We have used GPS for some time,” Densford said. “With the manual effort, it was easier to get a location wrong by incorrectly transposing long numbers of latitude and longitude which meant we weren’t able to create maps based on the data.”


With Survey123, location is automatically registered to the damage details and photos of the damage, making map-based reporting as easy as hitting a button.


Work is ongoing on streamlining the data flow from the data being collected in the templates to the Public Assistance grant program system (PA Grants Manager). This next step promises to speed the flow of funds needed to rebuild, repair or replace damaged infrastructure in impacted communities.


“We have priorities to reduce the complexity and deliver individual assistance quickly, and this tool speaks to both of those objectives,” Densford said. “We’re making the process more transparent and hopefully condensing the time it takes for a community to achieve recovery.”


Learn how to configure and optimize the FEMA Preliminary Damage Assessment templates using Survey123 in this GeoNet post.

more
1 0 4,816
BrendaMartinez
Esri Regular Contributor

By Mike Cox, Fire and EMS Industry Manager, Esri

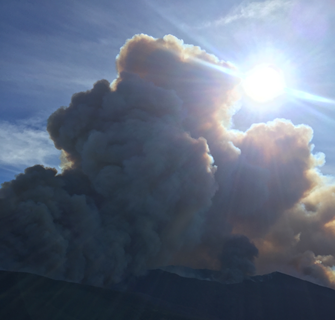
The 38th Esri User Conference (Esri UC) was an incredible success. When nearly 18,000 Esri geographic information system (GIS) technology users gather for a week of learning, networking, and sharing ideas, the result can only benefit all involved. The content ranged from integrating data from “low earth orbit” satellites to dealing with a total solar eclipse “where the sun don't shine”.

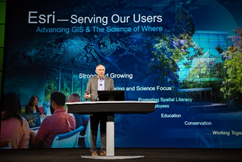
This was my first User Conference since becoming an employee of Esri, and while I had attended the Esri UC previously as a user, my role this year provided a new perspective on the event. It was humbling to see the commitment of Esri personnel to our user community. Our only focus is to support our users, to see them succeed, and to serve. It is through this servant role that we see the incredible accomplishments of our users. For those of us in the public safety industry, these accomplishments mean saving lives, preserving property, and protecting the environment. The 2018 Esri UC had multiple examples of GIS leveraged to do just that—maintaining safe communities and protecting our neighbors.

For the public safety team, the event started with the National Security and Public Safety Summit (NSPSS) @ Esri UC. The theme this year was Prepare for the New Normal—explore new ways to overcome increasingly complex and unpredictable threats and hazards. This two-day preconference event had its largest attendance to date. Over 450 defense, law enforcement, fire, emergency medical, and emergency management personnel gathered for presentations about the successful use of GIS.

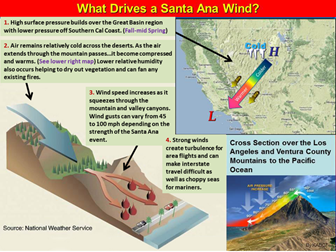
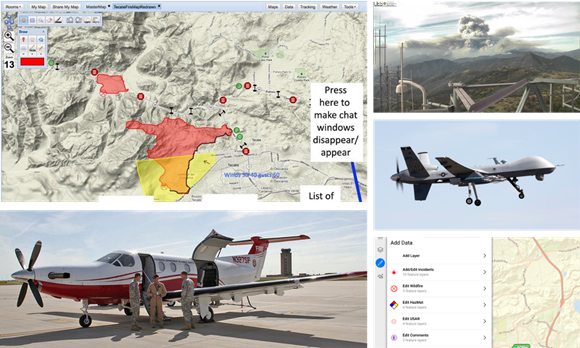
These NSPSS presentations covered topics including responding to wildfires, managing significant events such as the Super Bowl and the NCAA Final Four tournament, and sharing data with multiple agencies to coordinate preparations for and response to disasters. Local, state, federal, and international agencies demonstrated how GIS is used to prevent, assess, and respond to incidents. As an example, the European Union (EU) Satellite Centre presented on the use of satellite data to provide geospatial intelligence to a wide range of users within the European External Action Service and the EU member states. This presentation showcased the use of Esri technology, ranging from analysis performed on the desktop to the services being delivered through portals, from the management of the migration crisis to the support for the dismantlement of chemical weapons depots in Syria.

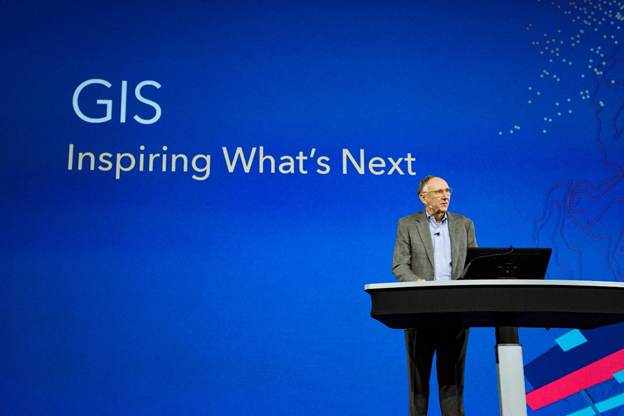
The theme of this year's Esri User Conference was Inspiring What's Next. As always, the main event began with Jack Dangermond presenting his vision at the Plenary Session. While his vision included where the technology is going, Dangermond started the week by having all in attendance consider what's next for our planet. What does that mean to individuals, families, and our communities? We live in a complex, interconnected world, and we can use geography to connect us. This constantly changing world creates many challenges—climate change, drought, deforestation, pollution, increasing urbanization, and many others. These challenges require us to fundamentally understand our world, as understanding precedes action. The Science of Where provides the framework and process for applying geographic knowledge that we can use to change our world. You can watch the 2018 Esri UC Plenary Session https://www.esri.com/videos/?event=594d5ac051b03b9718bde52b&title=Esri%20User%20Conference if you missed it earlier.

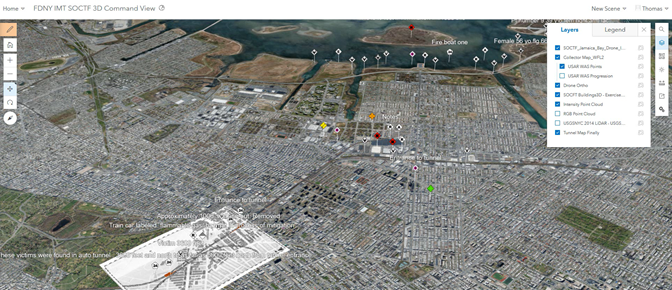
The Plenary Session maintained the Inspiring What's Next theme with a discussion of the emerging capabilities for the Esri platform. These capabilities include augmented reality, the Internet of Things, artificial intelligence, and machine learning. The increasing use of embedded devices in vehicles, clothing, and our environment—all with a geographic component—will impact our lives every day. With 3D capabilities providing a better understanding of our environment, first responders can—in seconds—identify the location of a person needing help, such as which floor in the building the person is in. GIS removes the technological complexities to allow us to solve real problems easily.

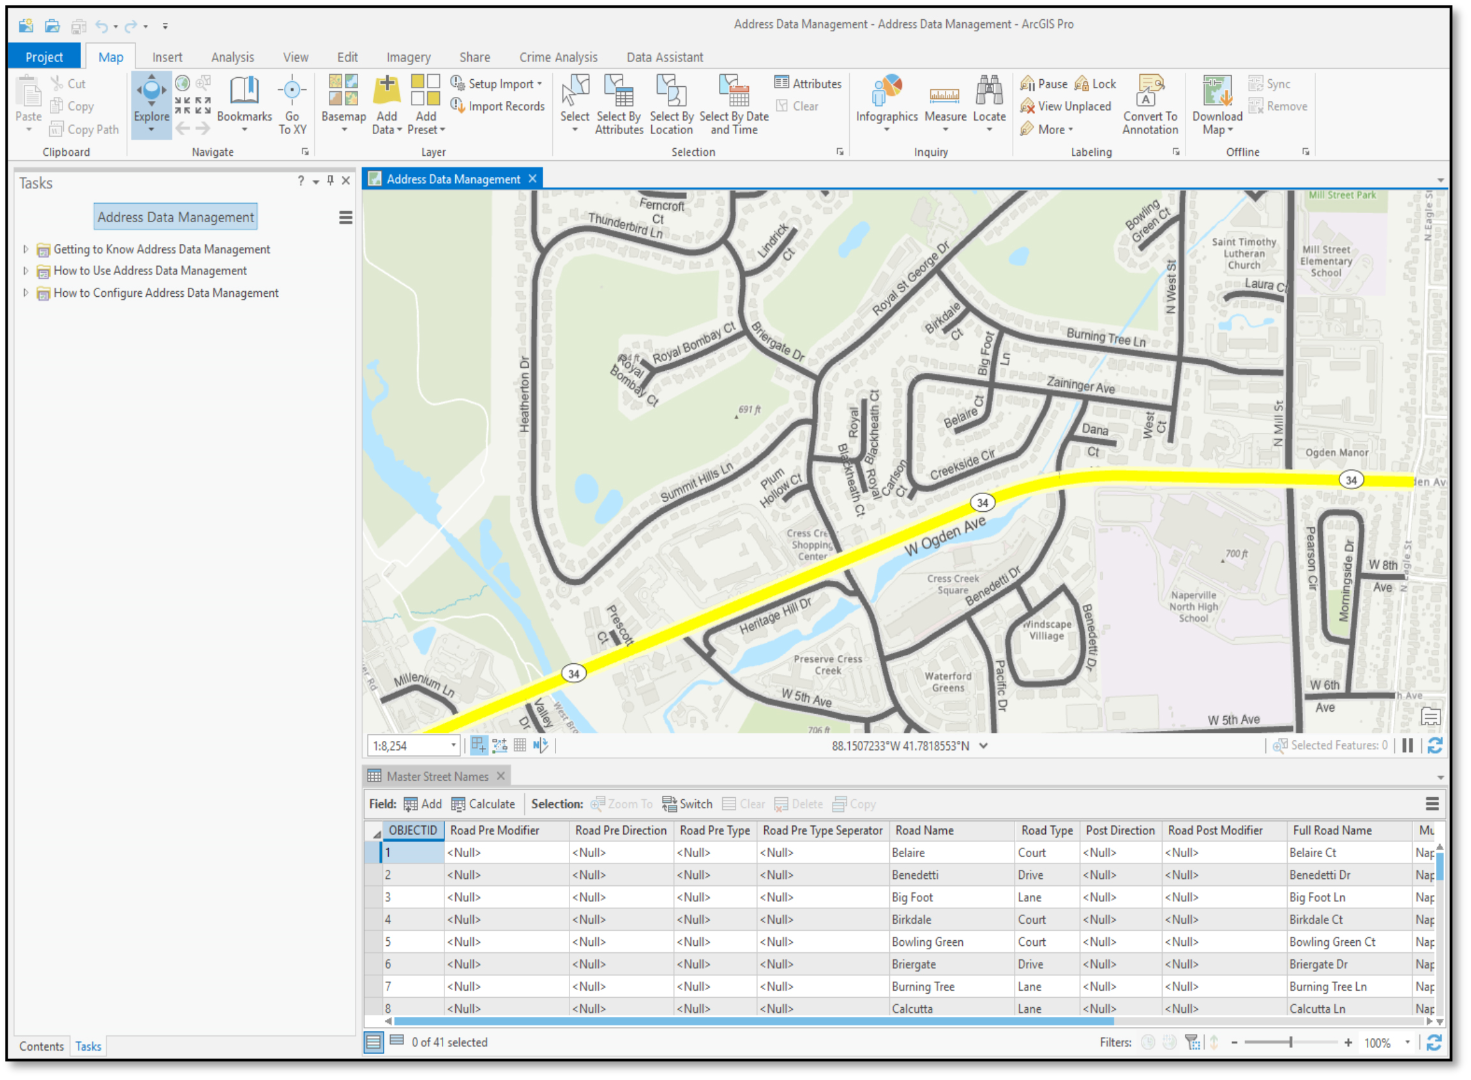
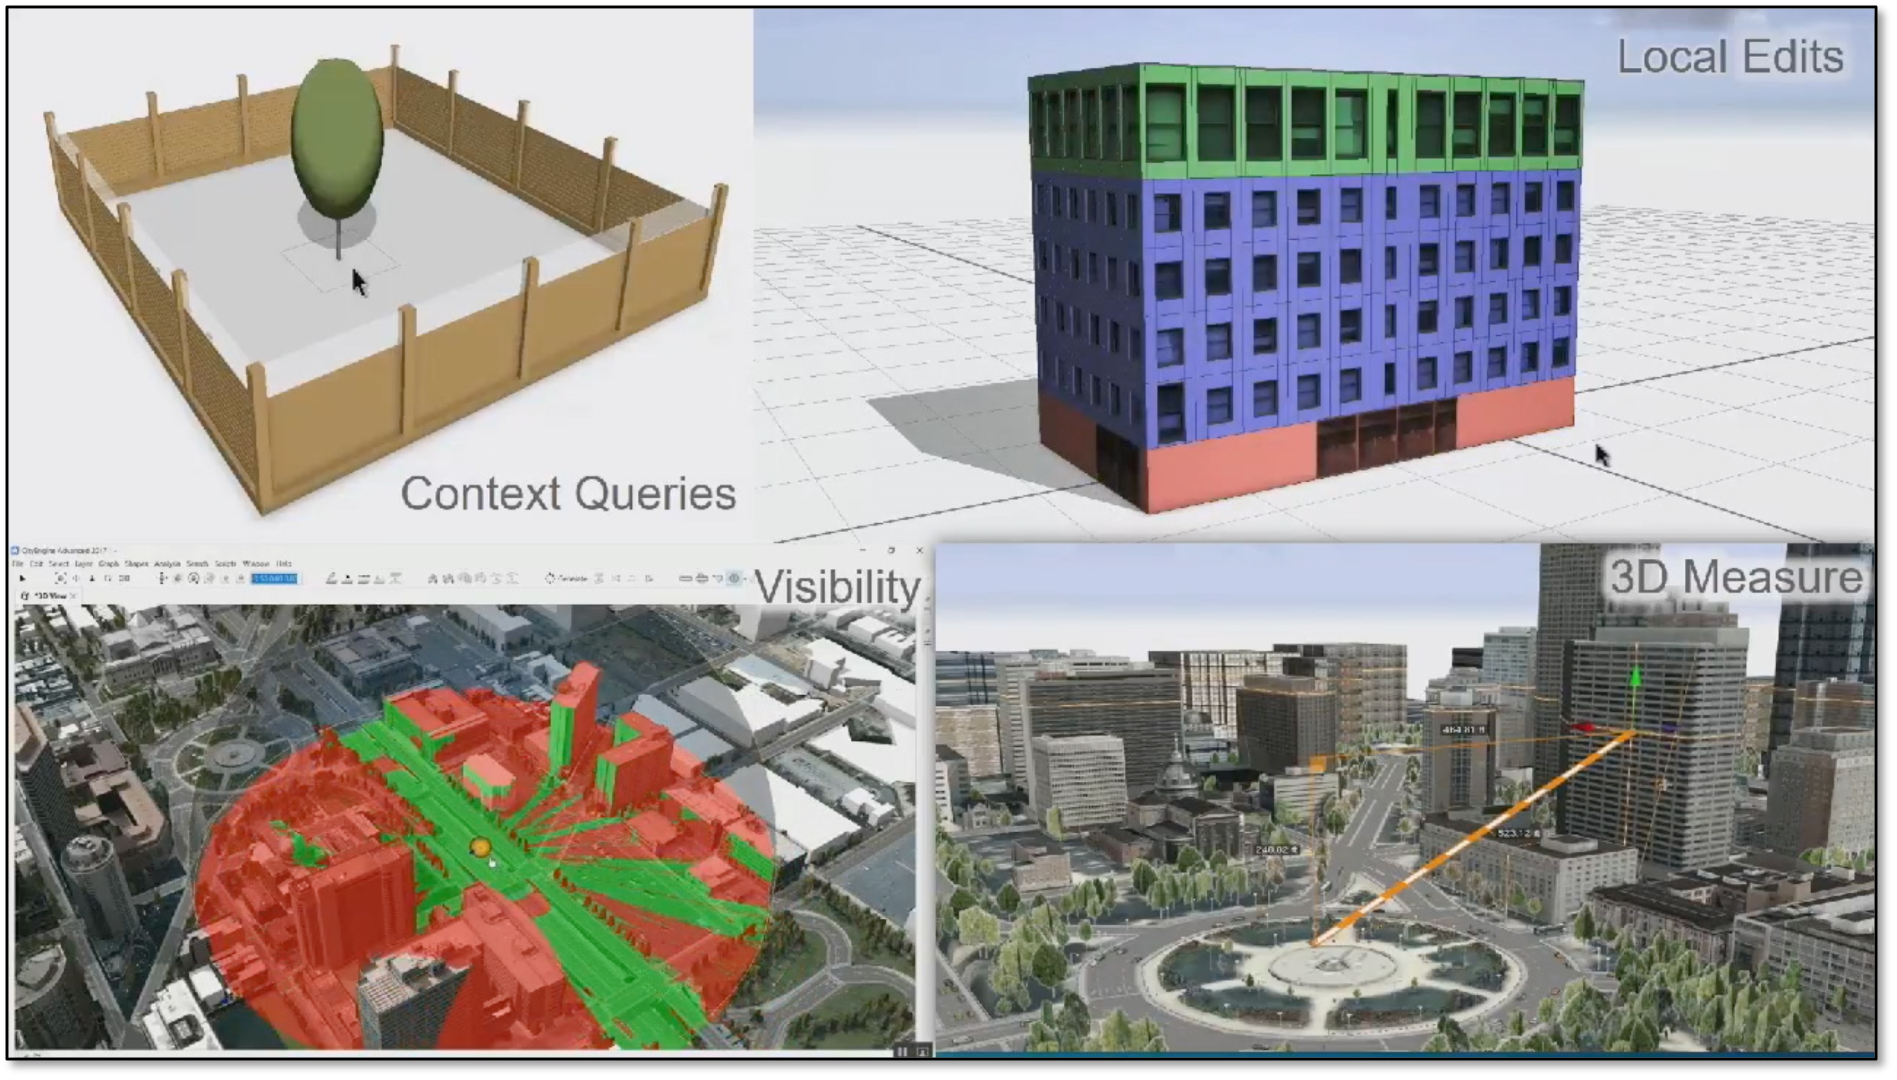
The latest release of ArcGIS Pro can help you visualize, edit, and analyze your geographic data in both 2D and 3D, providing full context to the area you are mapping. You are able to easily share your work—from mobile web scenes to paper maps—creating tailored experiences for different types of users. ArcGIS Pro 2.2 has many new features that are exciting, particularly when it comes to editing in 2D and 3D; performing quick visibility analysis; and sharing your 3D content on any device, anywhere, anytime.

Esri's ArcGIS Living Atlas of the World continues to evolve and provide multiple data sources for our users. One example of Living Atlas data is Sentinel-2 imagery for the entire planet. Each place on earth is reimaged every five days, and the data is updated daily. This service provides imagery and infrared views. The rich content of the Living Atlas is brought together in the Earth Systems Monitor. The monitor allows you to view climate data, real-time weather conditions, and urban development as well as a global human footprint map. You can review some of the Sentinel-2 capabilities at sentinel2explorer.esri.com/.

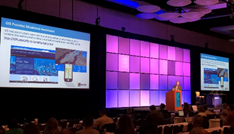
Thousands of attendees from over 140 countries gathered in the San Diego Convention Center to learn how the innovative use of GIS addresses the issues impacting our planet. Examples of this work included the following:

  • Environmental modeling and assessment
  • Planning and urban design
  • Engineering and public works
  • Utilities and telecommunications
  • Public health and demographics
  • Public safety and security
  • Portal for ArcGIS, open data, and citizen engagement
  • Cartography
  • Story maps

The week continued with multiple technical workshops on subjects ranging from basic GIS capabilities to in-depth data analysis and application use. These technical workshops can be reviewed at esri.com/videos/watch?playlistid=PLaPDDLTCmy4Z27yCYMJkyxj3WHtFBW08l&title=2018-esri-uc-technical-wor....

One of the event highlights for Esri staff is the direct interaction and support we provided to our customers. For the public safety team, these exchanges primarily occurred in the Public Safety Neighborhood at the GIS Solutions Expo. This area allowed us to provide one-on-one demos, answer questions about solutions, and demonstrate solutions from our partners. There were also comprehensive presentations by our skilled staff in the Operations Platform for Safety/Security (OPS) Center Theater.

The Esri UC always focuses on our user community and its success. Throughout the conference, attendees could join other users during their presentations about the use of GIS. One of the most interesting sessions I was able to attend was about one community's effort to deal with "Where the Sun Don't Shine"! Trich Van Wagner, GIS manager for Bonneville County, Idaho provided an extremely entertaining presentation about how the county used GIS to manage the influx of visitors in the Idaho Falls area for the August 21, 2017, solar eclipse. Hundreds of thousands of people across the nation were vying for the best viewing spot, impacting localities across the nation.

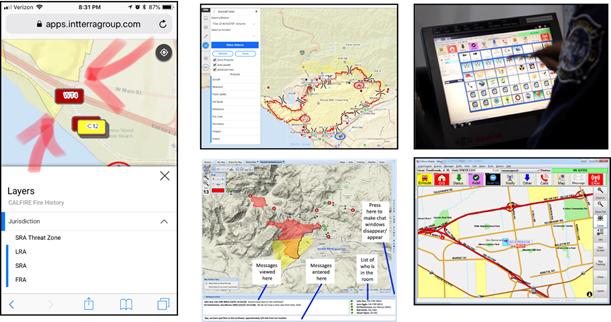
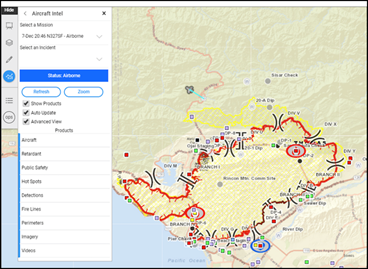
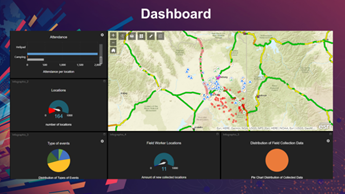
Van Wagner and Bonneville County staff leveraged GIS to create incident maps and web apps for local government use. They mapped campsites and emergency response resources, and they used mobile applications such as Survey123 for ArcGIS and the ArcGIS  environment to provide real-time incident data. This data was analyzed and communicated via story maps and dashboards. This presentation clearly demonstrated how The Science of Where helped provide a safe and efficient response to this significant special event.

Dangermond clearly stated that the goal of this year's Esri User Conference is unchanged from 38 years ago: to be together, learn from each other, share knowledge, and—from time to time—have a little fun. By all indications, we met this goal in 2018.

Please join us at the 2019 Esri User Conference, to be held July 8–12, 2019, at the San Diego Convention Center in San Diego, California. esri.com/en-us/about/events/uc/overview

more
0 0 1,268
BrendaMartinez
Esri Regular Contributor

By Mike Cox, Fire and EMS Industry Manager, Esri


The Thomas Fire was a wildfire that affected Ventura County, California, in December 2017. It burned approximately 281,893 acres becoming one of the largest wildfires in modern California history. The Thomas Fire caused two fatalities and destroyed at least 1,063 structures while damaging 280 others. The incident required the evacuation of over 90,000 residents.

The Ventura County Fire Department covers a county of 850 square miles with 950,000 residents. The fire department is innovating the use of technology in response to wildland-urban interface incidents. Ventura County has had some of the largest fires in California history and regularly responds regionally to support its neighbors. The fire department coordinates this response with the California Department of Forestry and Fire Protection (CAL FIRE) and the California Governor's Office of Emergency Services (Cal OES) at the state level.

The capabilities of agencies responding to these incidents are the best they have ever been. Despite these capabilities, this fire was one of the largest in state history. Environmental conditions, such as weather and fuel management, drive the occurrence and severity of these incidents. The intense Santa Ana winds fueled the Thomas Fire. The increase in the severity and number of these incidents requires the use of technology to improve the effectiveness of the response.

The Ventura County Fire Department deployed field observers to provide an initial assessment and an incident map and to begin to develop a common operating picture of the fire. The weather conditions preceding the Thomas Fire indicated the need for increased preparedness. Ventura had just deployed resources to other wildland incidents prior to the Thomas Fire. When the fire grew at such a fast rate, nearly all available resources were committed to rescue and evacuation of residents. This hindered the ability of field observers to perform the initial assessment, delaying the development of the common operating picture.

The county emergency operations center was assisting with the management of evacuations including the use of a reverse 911 system. In the midst of this operation, the area lost power complicating the evacuation effort. Fire department personnel were estimating the fire perimeter, and this information was being communicated through traditional and social media.

Examples of the mapping products used during the Thomas Fire response are shown below. These products include web and mobile based applications.

Ventura County Fire Department personnel used mobile devices to collect data in the field and transmit that data in real time. Frontline personnel viewed and updated the map from a mobile device.

Cal Fire's Situation Unit assumed the responsibility of developing the incident map. As the fire progressed into multiple operational periods, data from aerial reconnaissance, remote cameras, and Moderate-Resolution Imaging Spectroradiometer (MODIS) satellite was included in the mapping. This data, developed with Esri partner Intterra Group, was communicated to tactical units through mobile devices, shared with the emergency operations center, and sent to outside responding agencies.

The importance of using a single geographic information system (GIS) platform to develop and share this data with partner agencies was evident during the Thomas Fire. All map products were updated seamlessly, providing a current view to all stakeholders.

Lessons learned from this significant incident included developing policy and practice to share information electronically. The traditional methods are effective, but paper-based information products can prove to be difficult to maintain with real-time data during a fire incident. The fire ground changes rapidly under extreme weather conditions, so field units must have the most up-to-date information. The development of a common operating picture, the collection of incident intelligence, and the communication of this data must be a priority.

The planning cycle must be supported with accurate data. In an incident such as the Thomas Fire, a large number of resources had to be deployed rapidly. These resources needed to receive data in real time as they are deployed. The use of real-time data, GIS, and a common operating picture provided a more efficient, effective, and safer deployment of personnel and resources.

For additional information, please contact Esri publicsafetyinfo@esri.com or the representatives listed below:

Vaughan Miller, Deputy Chief, Ventura County Fire Department, vaughan.miller@ventura.org

Mike Cox, Fire and EMS Industry Manager, Esri, mike_cox@esri.com

David Blankinship, Cofounder, Intterra Group, david.blankinship@intterragroup.com

more
0 0 2,112
by Anonymous User
Not applicable

Around the world, emergency dispatch centers are grappling with outdated analog systems that are not capable of handling today’s complex mobile technology. Advances in text messaging, video, and sensor data now play important roles in information sharing. Migrating existing systems to digital solutions will provide more accurate location data and improve the transfer of critical information to PSAPs and those who are assigned as first responders. Download the 5 Ways GIS Empowers Next Generation 911 to learn how location intelligence can modernize your computer-aided dispatch. 

Download this eBook to Learn:

  • How to ensure first responders arrive at the right location
  • How you can consume real-time data feeds 
  • How to provide location awareness and indoor routing 
  • How to rout emergency calls to the correct PSAP 
  • How you can provide field interaction and reliability 

Download the Free Esri CAD eBook: CAD eBook 

more
0 1 1,174
73 Subscribers