Public Safety Blog - Page 2

cancel
Showing results for 
Show  only  | Search instead for 
Did you mean: 

Latest Activity

(67 Posts)
BrendaMartinez
Esri Regular Contributor

by Ryan Lanclos, Director of Public Safety Industries, Esri

Esri Releases New and Updated Pre-Configured Solution for Emergency Management Operations

Living in the Houston, Texas, area, my family and friends experienced Hurricane Harvey firsthand. This historic storm dropped more than 60 inches of rain in areas of southeastern Texas. Over a four-day period, Hurricane Harvey dropped enough rainfall to cover Harris County's 1,777 square miles with an average.... We were very lucky compared to many others around us and our property did not sustain any direct damage.

Looking at the global picture, we see how acute shocks associated with a changing climate, increasing social unrest, and evolving terrorism tactics are putting more people at risk every day. Compounding the effects of these threats and hazards are the ongoing, slow-moving stressors that underlay the fabric of our world. Chronic stressors, like poverty and aging infrastructure, tend to exacerbate the impact of acute shocks like Hurricane Harvey. As a result, the cost to our communities will continue to rise. According to the National Oceanic and Atmospheric Administration (NOAA), the United States set a new record in the cumulative cost of weather-related disasters, exceeding $300 billion. What used to be unthinkable has become our reality. This is our new normal.

        NOAA National Centers for Environmental Information (NCEI): 2017 U.S. Billion-Dollar Weather and Climate Disasters

Here at Esri, I have the privilege of leading a passionate team that is dedicated to helping organizations respond to incidents of all types and sizes. This team combines the science of geography with Esri's geographic information system (GIS) platform, called ArcGIS, to provide location intelligence 24 hours a day, 7 days a week, for organizations around the world. In the 20-year history of the Esri Disaster Response Program (DRP), 2017 was the busiest year. That is now our new normal.

Organizational Assessment

As a geographer, I believe that the element of location is key to understanding. I also believe that having a baseline location intelligence capability in place is a crucial component of being prepared for the new normal in emergency management. Organizations need the element of location to help them make better decisions, and they need solutions that enable these critical decisions to be data driven. Therein is the value of location intelligence.

I am often asked what the most common request is for the Esri DRP. People want to know what others are asking for so that they can assess whether they have that capability. It's like they are looking for a benchmark to measure their organization against. I think that is a great mind-set!

Instead of seeing just one challenge that you can assess your organization against, how about having a list so that you can do a true organizational assessment? Here are the most common business challenges we help organizations solve when we activate the Esri DRP (note that every single one requires location intelligence):

  • Monitoring real-time situational awareness
  • Understanding potential impacts to the community
  • Conducting initial damage assessments
  • Presenting dynamic incident briefings
  • Managing public information and scaling for the news media cycle

How Do You Compare?

Now that you know what the most common business challenges are, how do you compare? Do you have solutions for each challenge that, when combined, provide you with the baseline location capability outlined above? If you do, are these solutions integrated on a common operating platform that allows data and information to flow between apps and users? Can you get information out of your business systems and into the hands of partners or the public when needed?

If you can answer yes to these questions and you have trustworthy solutions for the challenges above, then my next question is this: how are you using these solutions on a daily basis for your agency's operations?

Integrating these solutions into the daily operations of your organization is the next step. Don't just shelve these solutions and expect to "break glass in case of an emergency." Use them to support daily operations, be confident in them, and continually update and maintain them so that you are ready for the next incident.

Where Next?

I hope we never have another storm like Hurricane Harvey, but we all know one is coming. Also, other disaster-related incidents like the recent wildland fires in Napa, California, and flooding in Ellicott City, Maryland, will continue to set new records and redefine normal. At Esri, we've learned a lot over the years while assisting our users through the Esri DRP, and I believe addressing the issues outlined above can help you be better prepared.

I'm excited that recent lessons learned have resulted in the release of a new pre-configured solution for emergency management operations that can improve your organization's operations during incident response as well as daily, "blue sky" operations. You can download and configure these solutions yourself, or we can provide Esri services to deploy and configure them for you. We can also help you develop a plan for surge staffing in your Emergency Operations Center (EOC), using qualified GIS professionals from Esri to augment your capacity if needed during a response.

Esri was founded as a private company in 1969 to help make a difference in the world, and we still carry that mission forward today. I work here because I believe in that mission, and I want to help you be better prepared when it comes to geospatial technology and GIS. I want to help you make a difference in your own organization, in your community, and in the world. It is going to require all of us working together to prepare for our new normal. Let's start working toward that baseline capability together.

Learn more about the Emergency Management Operations solution and start modernizing your agency’s operations.

more
1 0 1,555
BrendaMartinez
Esri Regular Contributor

By Ryan Lanclos, Director of Public Safety Industries, Esri

As San Antonio, Texas prepared to host the 2018 NCAA Men’s Final Four Championship in early April, a series of bombs exploded in nearby Austin.

“That put everybody on edge, then one of the bombs went off at the FedEx transfer facility in Schertz, which is just 17 miles up the road, and it brought the risk home,” said James Glass, deputy director of the Southwest Texas Fusion Center, one of many such centers across the US that collaborate with all first responders to detect, prevent, investigate and respond to criminal and terrorist activities.

Fears continue to escalate as the world experiences more tragedies at big events. In response, local and national law enforcement agencies are enhancing venue security and raising public awareness with promotional campaigns such as “If you see something, say something.”

“For the NCAA games, people were paying closer attention,” said Douglas Berry, San Antonio Fire Department Battalion Chief. “There were a lot more reports of suspicious packages, and the ability to vet those quickly was very important.”

Forces on Foot

The NCAA Final Four weekend in San Antonio included a three-day music festival at Hemisfair Plaza, a fan fest at the Henry B. Gonzalez Convention Center, and games at the Alamodome. With all event venues within walking distance of each other, hundreds of thousands of people milled around the city’s compact downtown. San Antonio deployed a large force of on-foot officers to ensure safety. The challenge for the Southwest Texas Fusion Center was twofold: give every officer the maps and data they needed for each event and maintain visibility of each officer’s location.

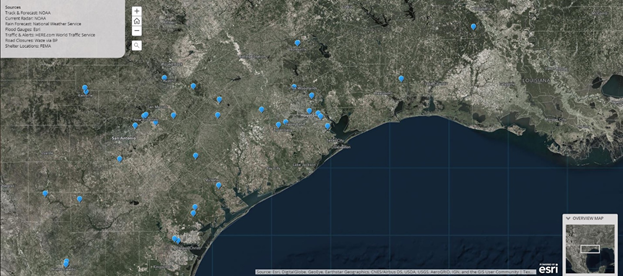
“We had been getting details on temporary setups from the NCAA months in advance,” said Sean Cummings, Public Safety Enterprise GIS Solutions Supervisor at City of San Antonio. “We put all of the details on the map, including the buildings, the booths, the road closures, the entrances, the access control points, the stage, and where lines would form.”

The Fusion Center deployed these maps to more than 200 networked smartphones. At command centers, staff could track and share the identity of each phone, and officers could search the map and share photos tied to locations.

Vetting Suspicious Packages

Word went out well before the events that attendees could only bring a clear bag no larger than 12-by-6-by-12 inches. Despite this widely broadcasted message, and free bags distributed at multiple locations, many people brought bags that they ditched when they realized that they couldn’t bring them inside a venue.

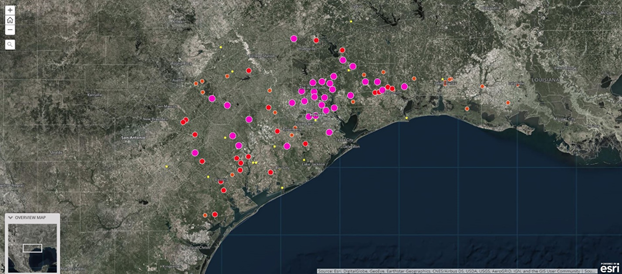
This lead to many suspicious bag reports and follow-up responses from officers and joint hazard assessment teams (JHAT) that specialize in bomb and hazardous material threats. With each call, came a rough location. Command post staff used a live common operating picture to correlate each report with the real-time location and input from responding officers. They also were able to access and point the closest CCTV camera to capture and share a view of the scene.

“Even if someone just left a bag, you can’t rule it to chance,” Glass said. “The teams collected 264 separate suspicious packages that they went through, cataloged, and put in the police property room.

In one case, a patrolman forwarded a picture of a suspicious package that turned out to be one of many remote hazardous materials monitoring stations. With the visual evidence, the JHAT team was immediately able to dismiss it and save a time-consuming trip.

“Photos let us vet each suspicious package a lot sooner,” Berry said. “That makes a huge difference on response times and resources when you go from making one run every couple of days to making more than 10 runs a day.”

More Big Moments

At many crucial moments during the NCAA weekend, maps proved vital for those charged with public safety. A few hours prior to the final game on Monday night, the Fusion Center team went out for a quick meal. Just then, they received two suspicious package alerts. Instead of rushing for the door, staff pulled out their phones to look at the live map. They watched a play by play as the package was investigated and revealed to be a harmless diaper bag that had fallen out of a minivan. This real-time situational awareness brought relief, and a much-needed dinner break, to Fusion Center staff.

During the March Madness Music Festival, Fusion Center staff noticed a sudden convergence of officers near the main stage. Training a camera on the gathering, staff noted that officers were not responding to an incident but were showing support for performer Jason Aldean, a country music star who was last on stage in Las Vegas in October 2017 when a gunman opened fire on the crowd. The officers gathered for an impromptu “we’ve got your back” moment, making their presence known to the performer and the crowd.

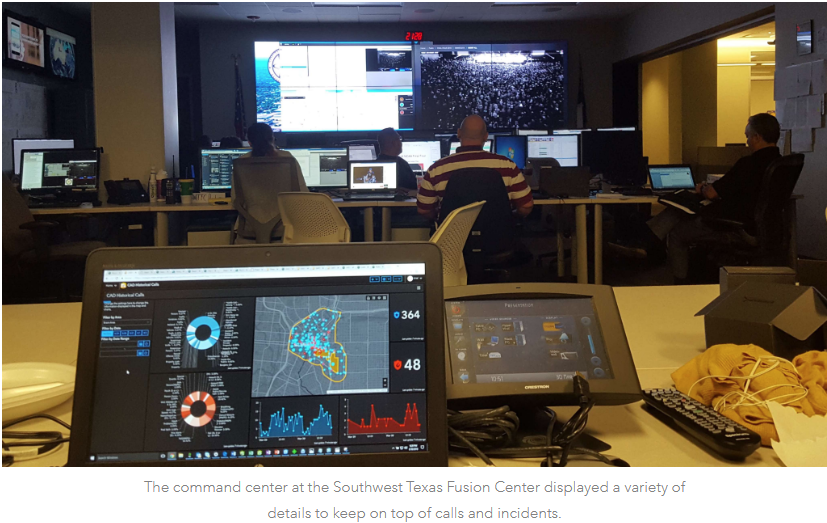
In command centers throughout downtown San Antonio, dashboards displayed details beyond the live common operating picture. Staff could see an incident log for different zones across all venues and a running tally of events with levels of activity. Dashboard users could zoom into each logged event for more details. Another dashboard provided the historical record, parsing the number of calls for service and types of calls over time.

Dedicated Bandwidth for First Responders


AT&T recently won the contract to set up a high-bandwidth first responder network called FirstNet, which provides a dedicated interoperable public safety broadband network. In the first phase, it prioritizes network bandwidth for every SIM card assigned to the FirstNet network, putting priority on messages and images shared by first responders. In phase two, it will provide a completely new infrastructure to separate law enforcement communication from consumer communication.


“It’s one thing to have the software and the hardware to do it, but you’re only as good as the cell phone towers,” Berry said. “When 200,000 people cram into a small area downtown, the network starts to bog down. It’s huge to be able to bump selfie traffic in order for law enforcement to communicate and send text messages and photos.”


The phones and the FirstNet network augment the professional radios that each officer carries. While the radios provide secure communications, they don’t provide location services or the ability to text or take photos. Because phones use GPS as well as WiFi and Bluetooth signals, each one returns an accurate location for the officer carrying it whether they were indoors or out.


Fusing Intelligence

Law enforcement agencies increasingly share intelligence, and today’s digital workflows make this easier. San Antonio set up its Fusion Center more than ten years ago, taking an all-crimes and all-hazards approach to information sharing across the city’s public safety community.

The need for a new special event management solution centered in the Fusion Center became apparent after an incident at the city’s annual ten-day Fiesta historical celebration. When someone passed out from heat exhaustion during the parade, emergency medical staff rushed in to help. Seeing this, nearby police officers thought it was the beginning of a fight and moved in. The two groups forcing their way into a small and crowded area caused some minor injuries in the crowd.

“It really screamed to us that we needed a common operating platform where we can communicate amongst each other,” Glass said. “We had two different dispatching systems and dispatchers that didn’t communicate in a crisis.”

The Fusion Center now centralizes calls for service and aggregates intelligence from a variety of different systems. Using mobile phones for the NCAA event made fusion easier than ever before by getting everyone on the same page fast. FBI agents, plainclothes police officers, and various food inspection and ordinance enforcement personnel each had their own phones. Everyone with a phone could easily access relevant information and communicate with their peers. Live tracking of each phone’s location gave the command centers a clear picture of available resources.

“That’s really the power of a web-based map,” said Aric Jimenez, special projects manager at the Southwest Texas Fusion Center. “You have nothing to set up except granting people access and sending them a URL.”

Accountability has become a driving force in law enforcement with the advent of body cams and bystanders taking and sharing images and videos from their phones. The solution San Antonio deployed for the NCAA Final Four helped in the moment and afterward by providing a record of the event.

“Going forward, it’s very important to not only track activity, but to look at the data a number of different ways, capture it, and then analyze it and do forecasting,” Berry said. “Everybody has a different perspective, fusion allows us to break down the data so that each person can see what they need when they need it.”

Using Smart Devices to Increase Situational Awareness

The Fusion Center deployed Workforce for ArcGIS to provide the common view for both the officers on foot and the command centers. The software provides the means to define the roles and work areas of different field workers. In this case, the Fusion Center defined the location and geographic extent of each officer’s post as well as the expertise and incident type best suited to each officer. It also provides the overall status of each person that both the Fusion Center and individual officers could view on a real-time map. This data fuels the Operations Dashboard for ArcGIS for the flexible display of real-time information at a glance. The software enhanced the centralized dispatching and incident response system, allowing the Fusion Center to efficiently and effectively respond to any call. Workforce and Operations Dashboard are used widely in public works, utilities, construction, field sales, and public safety domains. The software and mobile device applications fill in data gaps while maintaining connections to enhance the coordination of activities.

more
2 1 1,018
BrendaMartinez
Esri Regular Contributor

By Ryan Lanclos, Esri

You’ve heard for years how the world is undergoing a digital transformation (DX). In fact, your own home probably has more sensors than you realize. They might control everything from your air conditioning to lights or even provide real-time audio and video from your front door. However, many of us don’t fully realize that the ongoing digital transformation is more than just a buzzword or the inclusion of smart sensors into our homes.  Digital transformation is about how we apply and integrate digital technologies to support the business processes of our organizations. For those who work in public safety, the ongoing digital transformation around us presents an amazing opportunity to build safer communities.

As you plan your work in 2018, here are 4 key trends in public safety that will help you take advantage of the ongoing digital transformation. While some of these trends may currently be a disruption, they will become more common over the next few years. Now is the time to prepare and position your agency as a digital transformation leader in public safety.


Drones Fly High

In 2017, the Los Angeles Fire Department used drones for the first time to fight the Skirball Fire. ....


Machines Are Getting Smarter

Machine Learning (ML) continues to make ArcGIS smarter.  At Esri we are focused on where ML and GIS intersect which in turn means that public safety organizations will be able to make better data driven decisions.  For example, ML provides law enforcement agencies the ability to derive predictions about where crime may occur, or allow an emergency management planner to determine where a certain hazard might strike and what part of the community is most vulnerable.  The massive amounts of data already available within, and available to, many of our organizations becomes the training data that allows ML to work its magic.  By connecting the data in your records management system (RMS) to ArcGIS and then leveraging ML, you can gain insights on where to position your limited resources to mitigate potential issues. When a disaster strikes and post-event imagery is made available, ML enables you to classify an image to determine damage estimates in areas that may still be inaccessible.  ML will continue to evolve within ArcGIS and provide you with tools that help you make smarter and more data driven decisions. 


Real-Time and Event-Driven Actions

I started this article talking about how sensors are showing up in the most unexpected places.  But what about the sensors you have access to within your public safety organization?  Traffic sensors, cameras, stream gauges, weather stations, air quality monitors, and even smart assets like streetlights and trashcans provide you with real-time data that can be leveraged to your advantage.  By connecting to these sensors and exploiting the location element within this network of sensors, you can begin to trigger actions based on the real-time information you are receiving. When a certain set of criteria or business rules are met, your system responds to this new information in real-time.  A simple example might be that you proactively dispatch resources and alert citizens in a flood prone area based on changing weather conditions. Esri’s Real-Time GIS capability provides you with the tools to improve situational awareness and enable a faster response that can help save lives and property. Learn more at: go.esri.com/real-time-em.


Dedicated Connectivity

At the end of 2017, all 50 states opted-in to the nation’s first public safety dedicated broadband infrastructure that will support communications across the public safety industry. FirstNet provides communities with access to a broadband network that enables a much-needed priority flow of data and information to first responders.  This means that your GIS applications running on mobile devices in the field will have priority access to bandwidth during an incident.  The apps your first responders rely on will now have a dedicated network capable of providing high-speed connectivity that improves information delivery, collection, and collaboration.

Learn more about how Esri helps you embrace digital transformation in public safety by visiting go.esri.com/public-safety-em.

more
0 0 1,181
BrendaMartinez
Esri Regular Contributor

We look forward to seeing you at the 2018 FedGIS Conference. To help you and your organization gain the maximum benefit from this event, we have highlighted a few resources among the hundreds of different activities, workshops and Expo opportunities available on March 20-21.  Learn more at 2018 Esri Federal GIS Conference

more
0 0 1,009
BrendaMartinez
Esri Regular Contributor

Learn more about how the City of Chicago prepared for and successfully managed the 40th Bank of America Chicago Marathon using ArcGIS. This year's race included 45,000 runners and 1.7 million spectators.


“Chicago is a special event-driven city, and this is one of our biggest events of the year,” Thomas Sivak, deputy director of the OEMC said. “We have worked hard to establish a common operating picture to support our decision-making processes. Adding a real-time awareness of runners helps us know the size and complexity of any incident, and helps us manage the consequences.”

Read the full story at https://www.esri.com/about/newsroom/blog/chicago-adds-real-time-awareness/

more
1 0 731
BrendaMartinez
Esri Regular Contributor

After a watching the successful impact HIFLD for Harvey had on the response and recovery efforts for that disaster – supporting 6,000+ unique users – DHS has decided to launch a similar site to support the impending relief efforts for Hurricane Irma.  This decision was the result of the Federal Emergency Management Agency (FEMA) working with the Homeland Infrastructure Foundation Level Data (HIFLD) Committee Chair and Federal GeoPlatform system owner, along with the U.S. Department of Homeland Security (DHS) Geospatial Management Office to create this new Open Data website.  This new site is publicly accessible and based on the Esri ArcGIS Open Data application:


HIFLD for Irma – a sister Open Data site to HIFLD Open – is dedicated to unifying the response and recovery data aggregation efforts for Hurricane Irma.  HIFLD for Irma, creates a single authoritative source of relevant data for use by local, state, Federal, tribal, private sector, and community partners. It serves as a hub to aggregate and disseminate the best available relevant open data to support the massive mapping activities that are ongoing in support for Hurricane Irma response and recovery. New data and information will be added as it becomes available and is rapidly validated.


This site was created and is being supported by Esri Federal Small Business Specialty program partner ArdentMC.


If your organization has data to contribute, please send an email to HIFLD@hq.dhs.gov. Start using HIFLD for Irma today!  #HIFLD4Irma

Image result for hifld data

more
0 0 1,452
BrendaMartinez
Esri Regular Contributor

At the request of the Federal Emergency Management Agency (FEMA), and working with the Homeland Infrastructure Foundation Level Data (HIFLD) Committee Chair and Federal GeoPlatform system owner, the U.S. Department of Homeland Security (DHS) has launched a dedicated website to provide Open Data in support of Hurricane Harvey.  This new site is publicly accessible and based on the Esri ArcGIS Open Data application:

HIFLD for Harvey – a sister Open Data site to HIFLD Open (https://hifld-geoplatform.opendata.arcgis.com/) – is dedicated to unifying the response and recovery data aggregation efforts for Hurricane Harvey.  HIFLD for Harvey, creates a single reliable source of relevant data for use by local, state, Federal, tribal, private sector, and community partners. It serves as a hub to aggregate and disseminate the best available relevant open data to support the massive mapping activities that are ongoing in support for Hurricane Harvey response and recovery. 

This site is being actively managed by Esri business partner Ardent MC. New data and information is being added as it becomes available and is rapidly validated.

If your organization has data to contribute, please send an email to HIFLD@hq.dhs.gov. Start using HIFLD for Harvey Today!  #HIFLD4Harvey

Image result for hifld data

more
2 0 4,274
BrendaMartinez
Esri Regular Contributor

The impacts of Hurricane Harvey are being felt far and wide. As the rain continues to fall, and flood waters rise, an army of citizen-rescuers are answering the call. They are bringing their boats to bear and are plunging into waist-deep waters to help those in their communities. While it’s not possible for all of us to lend a helping hand directly, those that know GIS can lend a hand from afar.


The need for expertise on the many “where” questions of a disaster continue to grow, answering such questions as

  • Where are the one-story homes that are about to be immersed?
  • Where are dry beds and shelters for those that are displaced?
  • What are the quickest and safest routes to evacuate the most people in the shortest amount of time?


As the government encourages citizens to help one another, the non-profit organization made up of mapping experts is answering the call. GISCorps, a program of the Urban and Regional Information Systems Association (URISA), has been providing a range of mapping and disaster response services for more than 14 years worldwide.


GISCorps volunteers conduct most of their work remotely and nearly half of their work responding to disasters. These volunteers harness the power of the cloud-based ArcGIS Online platform for such tasks as data collection, data cleansing, and creating story maps and map galleries to communicate needs and impacts.


“GISCorps volunteers have been involved in almost every disaster since 2003,” says Shoreh Elhami, the founder of URISA’s GISCorps. “We have worked on Hurricane Katrina, the Asian tsunami, the cyclone in Burma, the Ebola epidemic, and many more.”


Volunteers gain the satisfaction of helping those in need, and there are many ancillary benefits.


“Many of our volunteers have said they learn more quickly from GISCorps experiences than from their day jobs,” said Elhami. “They get exposed to different projects that require different skills and tools, and that provides a valuable learning experience.”


GISCorps uses ArcGIS Online to spread the work among volunteers and to create a communication platform to share updates on unfolding events.


“Thanks to the backing from the Esri Disaster Response Program, we have a backend that supports the work of our volunteers,” said Elhami. “We can ingest and process imagery, and to digitize points of interest in a way that’s much easier than in the past. I’m really excited about putting our 5,000 volunteers to work doing a lot more.”


Applying to become a GISCorps volunteer can be done only online.

more
5 5 4,975
BrendaMartinez
Esri Regular Contributor

Hurricane Harvey, at one point a category 4 hurricane, has brought devastating amounts of rainfall with extensive damages to Texas and Louisiana. As Harvey continues its catastrophic path, Esri’s Disaster Response Program (DRP) is here to support you around the clock 24/7.


If you need support with additional software, data, or technical support you can request immediate assistance from the DRP.

The Hurricanes and Tropical Cyclones Overview map provides up to date information on the potential impact, precipitation, and path of Harvey.


Emergency management agencies are also using social media and crowd sourcing to gain insight on the situation. This Crowdsource Story Map helps responders and emergency managers gain insight into the situation on the ground.


The Tropical Strom Harvey: Current Conditions Application

This interactive web application features Hurricane Harvey tracking, traffic alerts, road closures, shelter locations, flood gauges and more.

Track and forecast the path of Harvey:

Stay up to date with traffic alerts and closures:

Locate a shelter location nearest you:

Analyze the current situation of flood gauges:

Analyze 72-hour precipitation forecast:

Follow the DRP on Twitter and Facebook for the latest news.

more
3 0 4,580
BrendaMartinez
Esri Regular Contributor

By Chris McIntosh, Director, National Government Industries, Esri; and Bob Greenberg, CEO, G&H International Services, Inc.


Imagine a small town that has just suffered a significant natural disaster. It is almost always the case that the town will need to reach out to other jurisdictions to get help in the form of people and resources to respond effectively to the incident. To prepare for this common scenario, emergency managers need to develop a response strategy that identifies the resources they need and reveals where they will face shortfalls. Many emergency managers today use the Threat Hazard Identification Risk Assessment (THIRA) process to do just that, but when they do, the result is often a paper report in a binder or a static digital document that they have to dig out during an emergency.

Many of those same emergency managers also have access to an ArcGIS mapping platform that enables them to obtain rapid situational awareness of what is occurring during an incident—in near real time. Configured to provide essential elements of information (EEI), the system helps them understand things like the location of power outages, road status, and shelter status—all of which are very useful for identifying necessary resources and deploying them (see the National Information Sharing Consortium's [NISC] guidance on EEI's.

Situational awareness is very important in emergency management. It allows personnel to quickly visualize and understand the impact of an incident, identify trends, and predict outcomes. This leads to more accurate assessments and saves time—the most precious of all resources.

Connecting this insight to the actual deployment of resources is where the Threat Hazard Identification and Risk Assessment (THIRA) process tends to stall. Even armed with the most modern situational awareness tools, logistics personnel often have to revert to the paper plan to identify and find the resources they need—a process that is very time-consuming—as they go back and forth between their map, their planning documents, and other systems. They lose precious minutes and hours in identifying the resources; finding the right contact; contacting the resource provider; determining availability; and, ultimately, deploying the resource.

What if they had all that information, available in real time, on one platform? It would allow them to instantaneously identify an incident, understand the situation, and find and deploy the appropriate resources. The key to doing that is the ability to operationalize a resource plan by integrating it with their situational awareness system. Esri's ArcGIS platform provides that ability.

The Mutual Aid Resource Planner (MARP) tool, developed by Esri partner G&H International Services on behalf of the First Responders Group (FRG) of the Department of Homeland Security's Science and Technology Directorate, enables planners to develop more accurate plans by integrating additional geospatial hazard and risk information. They can also preidentify partners that will help provide aid and fill resource gaps. These capabilities, integrated with the ArcGIS platform—which provides emergency responders across jurisdictions with a visualization of the existing and emerging situation in real time—allow them to collaborate on identifying resources and assigning responsibilities.

Requirements for the MARP application were initially developed during the CAPSTONE-14 exercise conducted by the Central US Earthquake Consortium (CUSEC), where emergency planners and managers from eight states identified the need to extend the planning concept outlined by the THIRA process. What became clear during the exercise was the importance of both operationalizing the THIRA process and preidentifying the required resources in order to track their availability during an event.

With Esri's support, G&H provided technical assistance to the CUSEC states during the CAPSTONE-14 exercise and began working with Esri's ArcGIS platform to configure its templates and applications to provide those capabilities. MARP is empowered by the ArcGIS platform, which provides access to data from multiple sources across various disciplines and jurisdictions to help emergency managers make fast and well-informed decisions regarding resources.

MARP has been tested through several experiments by multiple levels of government agencies. This past January, the MARP capabilities were tested as part of the first experiment under the FRG's Flood Apex program in New Orleans. It was also used by Michigan and Ontario, Canada, to develop cross-border mutual aid plans during the CAUSE (Canada-U.S. Enhanced Resiliency Experiment) IV Experiment in April 2016.

MARP allows agencies to develop a more efficient plan for dealing with the aftermath of catastrophic events. It provides a simple yet innovative template that makes it easy to collaborate and share data among different jurisdictions. Building a better plan will help to strengthen a community's preparedness and resiliency. MARP is available to members of NISC, an Esri-supported organization dedicated to improving information sharing for better emergency preparedness. Membership is free. For MARP training, visit http://nisconsortium.org/marp1.0/training/.

For further information, visit https://www.dhs.gov/science-and-technology/news/2017/04/05/responder-news-mutual-aid-resource-planni....

more
2 0 1,115
82 Subscribers