- Home
- :
- All Communities
- :
- Products
- :
- Mapping
- :
- Mapping Questions
- :
- Re: Time Slider
- Subscribe to RSS Feed
- Mark Topic as New
- Mark Topic as Read
- Float this Topic for Current User
- Bookmark
- Subscribe
- Mute
- Printer Friendly Page
Time Slider
- Mark as New
- Bookmark
- Subscribe
- Mute
- Subscribe to RSS Feed
- Permalink
I am using Time Slider with a data set that has points over a year long period. I've set it up to display in one week increments. I would like for it to only show that week but it seems to be cumulative. So in the end I have the entire year worth of data displayed when I would really like to end with the most recent week displayed. Is this possible?
- Mark as New
- Bookmark
- Subscribe
- Mute
- Subscribe to RSS Feed
- Permalink
have you examined all the variable properties in the help About modifying the time slider properties—Help | ArcGIS for Desktop like the start and end time? Modifying the start and end time of the time slider—Help | ArcGIS for Desktop
- Mark as New
- Bookmark
- Subscribe
- Mute
- Subscribe to RSS Feed
- Permalink
Thanks, I'm not sure how I missed that.
- Mark as New
- Bookmark
- Subscribe
- Mute
- Subscribe to RSS Feed
- Permalink
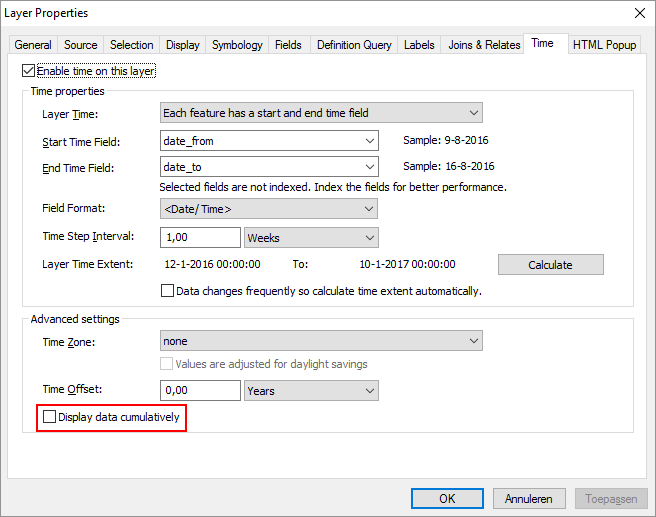
In ArcMap you can do this using the links provided by Dan. In the properties of the layer, make sure the option "Display data cumulatively" is unchecked:
In ArcGIS Online you can do this too: see: Configure time settings—ArcGIS Online Help | ArcGIS and scroll down to Time Display:
- Choose only display the data in the current time interval to show only the data that falls within the time interval. For example, if you have data representing hurricane paths over a 10-year period and you want to show the paths of all hurricanes that occurred within a given year, you would choose this option (and specify 1 Year as your time interval). As the map animates, you see the hurricane paths for the first year, the second, the third, and so on. Each year of data displays independently of the other years.
- Choose progressively display all the data to show all the data over time. For example, if you have data representing hurricane paths over a 10-year period and you want to display all the hurricane paths that occurred over the 10-year period in successive years over the previous years, you would choose this option (and specify 1 Year as your time interval). As the map animates, you see the yearly hurricane paths cumulatively over 10 years.
You should use "only display the data in the current time interval".
- Mark as New
- Bookmark
- Subscribe
- Mute
- Subscribe to RSS Feed
- Permalink
I was wondering if that fixed the problem? On my data, when I uncheck Cumulative, NOTHING shows up!
- Mark as New
- Bookmark
- Subscribe
- Mute
- Subscribe to RSS Feed
- Permalink
Could you share your settings and tell a little more about the data you are showing (range of dates, number of features, single dates or date range)? It may be the way you configured your visualization.
- Mark as New
- Bookmark
- Subscribe
- Mute
- Subscribe to RSS Feed
- Permalink
I am using ArcMap 10.3. It is one file with a single date range. It works in cumulative mode only. I have it set to daily between 2016/01/01 00:29:36.39 to 2016/11/22 17:07:30.86. There are 3938 records in this file. Time is enabled.
On theTime Slider I have it set to Central Time (US & Canada) though I am not using it. The time step interval is 1 day. I am showing the time clock on the display. The time extent is set to my file. Playback has been slowed a bit. Refresh is not set.
The background static data is all under a new basemap layer.
I have three graphs, but closed or open makes no difference. The points do not display without the cumulative checked.
- Mark as New
- Bookmark
- Subscribe
- Mute
- Subscribe to RSS Feed
- Permalink
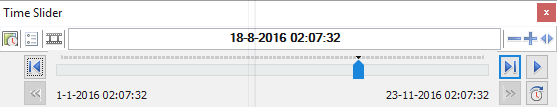
There is a setting which you need to adjust to get the proper effect. Let's explain how this works... You have date-time objects, and each point has a certain date and time defined. When you calculate the range and set the interval and step each day it will only show the points that have a date AND time defined at that particular spot. See the interface below. In this case it will show all the points of the displayed date and time, and most likely there will be none, so you don't see anything...
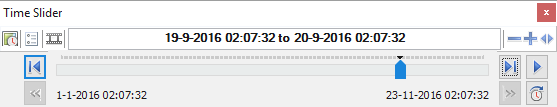
If you change the options and set a "TIme window" of 1 day it will now not show a single date-time moment, but an entire day, which will show several points:

Below a screenshot of how your time slider will look:
The testdata that I used was generate with a python script:
#-------------------------------------------------------------------------------
# Name: generate_random_date_points.py
# Purpose:
#
# Author: Xander
#
# Created: 26-01-2017
#-------------------------------------------------------------------------------
from random import randrange
import arcpy
def main():
import os
from datetime import datetime
arcpy.env.overwriteOutput = True
fc = r'C:\GeoNet\RandomDates\gdb\data.gdb\points_v01'
num_features = 4000
fld_datetime = 'myRandomDateTime'
fld_date = 'myRandomDate'
sr = arcpy.SpatialReference(28992)
# 2016/01/01 00:29:36 to 2016/11/22 17:07:31
d1 = datetime.strptime('2016/01/01 00:29:36', '%Y/%m/%d %H:%M:%S')
d2 = datetime.strptime('2016/11/22 17:07:31', '%Y/%m/%d %H:%M:%S')
# create featureclass
fc_ws, fc_name = os.path.split(fc)
arcpy.CreateFeatureclass_management(fc_ws, fc_name, "POINT", None, None, None, sr)
# add fields
arcpy.AddField_management(fc, fld_datetime, "DATE")
arcpy.AddField_management(fc, fld_date, "DATE")
flds = ('SHAPE@', fld_datetime, fld_date)
with arcpy.da.InsertCursor(fc, flds) as curs:
for cnt in range(num_features):
pntg = getRandomPoint(sr)
my_datetime = random_date(d1, d2)
my_date = my_datetime.date()
curs.insertRow((pntg, my_datetime, my_date, ))
if cnt % 100 == 0:
print "Processing point", cnt
def getRandomPoint(sr):
x_range = [100000, 140000]
y_range = [100000, 130000]
pnt = arcpy.Point(randrange(x_range[0], x_range[1]), randrange(y_range[0], y_range[1]))
return arcpy.PointGeometry(pnt, sr)
def random_date(start, end):
"""
This function will return a random datetime between two datetime
objects.
"""
# http://stackoverflow.com/questions/553303/generate-a-random-date-between-two-other-dates
from datetime import timedelta
delta = end - start
int_delta = (delta.days * 24 * 60 * 60) + delta.seconds
random_second = randrange(int_delta)
return start + timedelta(seconds=random_second)
if __name__ == '__main__':
main()- Mark as New
- Bookmark
- Subscribe
- Mute
- Subscribe to RSS Feed
- Permalink
Thank you for your reply. I actually spent several hours on the phone the other morning with Danny in customer service. (01878791). This was one of a number of problems. The change you recommended, works for that entry, but causes the others to double up.
It sets midnight of the first day to midnight the second day. It really needs to be one 24 hour period. I am planning on adding a simple date column without the time attached so I don’t have to use the window.
Two out of three datasets worked like they were supposed to. The third was set-up exactly like the second as far as commands (different columns in the table, but format the same where used). But it will not display the symbolized marker with graduated size based on quantity. It selects the correct records, but it will not show them.
An issue not covered, as Danny wasn’t familiar with them where the graphs of the time material. One updated as the times changed (but there is apparently no way to show the time on the chart). The other two remained static.
At any rate, I thank you for your directions! I had totally forgotten that window option.
Nancy
Nancy S. Dorsey
Environmental Scientist
Oklahoma Class II Program Manager
WQ-SG EPA Region 6
1445 Ross Ave. #1200
Dallas, TX 75202-2733
214-665-2294
FAX 214-665-2191
UIC Webpages:
http://www.epa.gov/uic/underground-injection-control-epa-region-6-ar-la-nm-ok-and-tx
http://www.epa.gov/uic/guidance-documents-completing-class-i-injection-well-no-migration-petitions
Managing and Minimizing Potential of Injection-Induced Seismicity from Class II Disposal: Practical Approaches: http://www.epa.gov/uic/underground-injection-control-national-technical-workgroup-final-issue-papers
- Mark as New
- Bookmark
- Subscribe
- Mute
- Subscribe to RSS Feed
- Permalink
Hi! I am using arcgis javascript api for Arcgis 4.16, Can some one guide me is it possible to start my time slider from the current date (end date). I mean, When i open my map the time slider shows the map of start date and when the slider moves it will start progressing towards the current date and finally ends at current date. Now I want that whenever i load my map the current date shows first.