Turn on suggestions
Auto-suggest helps you quickly narrow down your search results by suggesting possible matches as you type.
Cancel
- Home
- :
- All Communities
- :
- Products
- :
- Mapping
- :
- Mapping Questions
- :
- Issues with xy data for a class project
Options
- Subscribe to RSS Feed
- Mark Topic as New
- Mark Topic as Read
- Float this Topic for Current User
- Bookmark
- Subscribe
- Mute
- Printer Friendly Page
Issues with xy data for a class project
Subscribe
4318
4
03-18-2012 02:02 PM
by
Anonymous User
Not applicable
03-18-2012
02:02 PM
- Mark as New
- Bookmark
- Subscribe
- Mute
- Subscribe to RSS Feed
- Permalink
Original User: rmartori
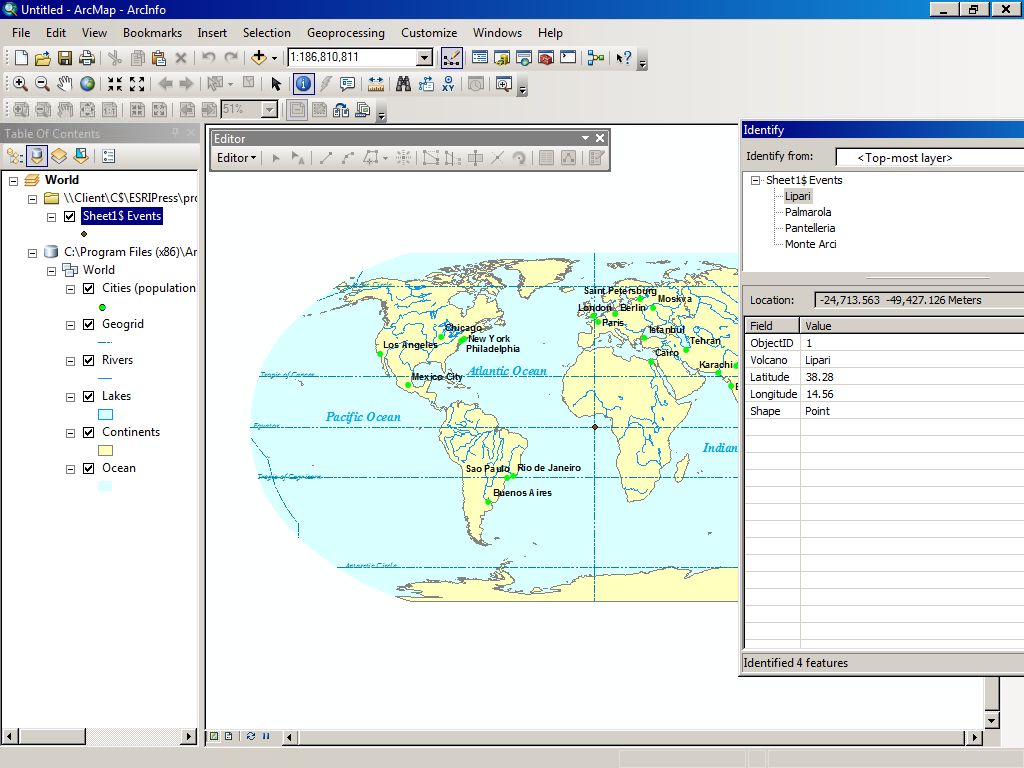
I am doing a class project listing out the various volcanoes near Italy as sources of obsidian and the sites where obsidian has been found and lastly routes that could have been used to get the obsidian to where it was found. however when I import the excel data with add xydata option the points never go properly in the first picture below it seems to omit the site name and the latitude data so the data just spreads across the equator.
[ATTACH=CONFIG]12791[/ATTACH]
however one thing that did seem to work was when I imported the data with nothing else loaded just a totally blank map, however when I then save that as a layer and import it to a map it seems to be slightly off from where it should be and no clue how to fix it.
however I recently started having a new problem now instead of omitting one set of coordinates it keeps them listed but displays them at 0 lat and 0 long
[ATTACH=CONFIG]12792[/ATTACH]
however if I select the xy data and hit zoom to layer it does show that they are spread out roughly in the proper way but you have to zoom to 1:25 to see it.
my excel data for the volcanoes is simply this
ObjectID Volcano Latitude Longitude
1 Lipari 38.28 14.56
2 Palmarola 40.56 12.51
3 Pantelleria 36.46 12.01
4 Monte Arci 39.46 8.44
the obsidian sites is a bit bigger because it also has a list of obsidian types that I am keeping a ratio of.
But sadly I have no clue how to fix this issue. I am using archmap 10
Any help anyone can give me would be great I am basically teaching myself this program for an archaeological science course.
4 Replies
by
Anonymous User
Not applicable
03-18-2012
11:44 PM
- Mark as New
- Bookmark
- Subscribe
- Mute
- Subscribe to RSS Feed
- Permalink
Original User: Hardolph
Ryan,
Importing X-Y data directly from excel is often problematic because ArcMap scans the first 6 records to determine a data type and can get messed up between text and numbers. It is generally best to save the data in .csv format first, check the data and load from that. I copied your table into Notepad, deleted the space in one name and imported to excel then saved as csv and they plotted OK except that the Lat-Long coordinates for the volcanoes are quite a bit off: Pantelleria is showing up 40 km south of where it should be and the others are similarly out. You could probably just ADD a map from the Resource center (on the File menu) and make points in a feature class at the correct volcanoes.
Hardolph
03-19-2012
07:32 AM
- Mark as New
- Bookmark
- Subscribe
- Mute
- Subscribe to RSS Feed
- Permalink
Because they're showing up near 0,0 I think you're letting the Add XY Data tool set the coordinate system to the data frame's, which looks like Robinson or something similar (I didn't take a close look at the images you posted). When adding the xy data, change the coordinate system WGS84 or whatever geographic coordinate system, the values were collected in. ArcMap will then project on-the-fly (in memory) the points to the data frame's coordinate system.
Melita
Melita
by
Anonymous User
Not applicable
03-19-2012
09:23 PM
- Mark as New
- Bookmark
- Subscribe
- Mute
- Subscribe to RSS Feed
- Permalink
Original User: rmartori
That'll be fine for the volcanoes, the problem will be when I have to do it with upwards of about 900 sites for where obsidian was found.
Here is a question then is there anyway I can drag that group of files to line them all at once? I might eb able to at least gt them abit more accurate
Ryan,
Importing X-Y data directly from excel is often problematic because ArcMap scans the first 6 records to determine a data type and can get messed up between text and numbers. It is generally best to save the data in .csv format first, check the data and load from that. I copied your table into Notepad, deleted the space in one name and imported to excel then saved as csv and they plotted OK except that the Lat-Long coordinates for the volcanoes are quite a bit off: Pantelleria is showing up 40 km south of where it should be and the others are similarly out. You could probably just ADD a map from the Resource center (on the File menu) and make points in a feature class at the correct volcanoes.
Hardolph
That'll be fine for the volcanoes, the problem will be when I have to do it with upwards of about 900 sites for where obsidian was found.
Here is a question then is there anyway I can drag that group of files to line them all at once? I might eb able to at least gt them abit more accurate
03-20-2012
03:42 PM
- Mark as New
- Bookmark
- Subscribe
- Mute
- Subscribe to RSS Feed
- Permalink
Hi Ryan,
Melita is correct about the volcano data: you've ADDED them as X-Y data to a projected Data Frame calibrated in meters that has its origin at Latitude 0, Longitude 0 so the point for e.g. Pantelleria, which should be at 1058938 E, 3928821 N on a Robinson projection (more of an asthetic display) comes out at 36.46 m N , 12.01 m E of 0 degrees Lat and Long, because the numbers, which should have been indicated as degrees of Lat and Long were interpreted as meters. For starters you can re ADD_X-Y_Data the table of volcanos specifying a Geographic Coordinate System such as WGS-84 and they will plot up as I previously observed.
The sytematic mistake in the coordinate data for the volcano is not the coordinate system, but that the decimal digits are not decimal degrees they were supposed to be minutes, which is why they all plot off to the south or southwest of true (notice they are all less than xx.60). See the inserted map of the Tyrrhenian Sea showing the misinput locations in green pentagons and the corrected locations in red triangles. I just divided the decimal part by 60 and added the full degree digits and they plot correctly. [ATTACH=CONFIG]12883[/ATTACH]
Table of correct Volcano coordinates
ObjectID Volcano Latitude Longitude
1 Lipari 38.47 14.93
2 Palmarola 40.93 12.85
3 Pantelleria 36.77 12.02
4 MonteArci 39.77 8.73
For your obsidian site locations, once again make sure you enter the coordinate system of the X-Y data when you use the Add-XY Data tool or they will plot on the equator since you have used a base map in a Projected Coordinate system. Like the Volcano data when plotted they appear to be highly approximate since some of the points plot out to sea, but unlike the volcanoes I don't know where they are supposed to plot and there are several coordinates that have decimal digits greater than 0.60 so they can't all be minutes. I'd check the source of the data and how they were transcribed. There also seem to be errors in the attributes as exemplified by the relatively precisely defined point for Gaione, Italy at 43.7034, 7.2663 that plots in Nice, France.
Hope you are able to sort it out once you get beyond the initial data plotting issue.
Hardolph