- Home
- :
- All Communities
- :
- Products
- :
- Mapping
- :
- Map Advice Community Questions
- :
- Hello! Need some help with coloring data and chang...
- Subscribe to RSS Feed
- Mark Topic as New
- Mark Topic as Read
- Float this Topic for Current User
- Bookmark
- Subscribe
- Mute
- Printer Friendly Page
Hello! Need some help with coloring data and changing data over time.
- Mark as New
- Bookmark
- Subscribe
- Mute
- Subscribe to RSS Feed
- Permalink
Hi there!
I need some help with my map. I am trying to plot 6 points and I want them to change size over time (10 years of varying magnitude values for each point). I would also like the points to change color according to their value (green when small, yellow when large). Does anyone have any tips?
Thank you!!
Grayson
- Mark as New
- Bookmark
- Subscribe
- Mute
- Subscribe to RSS Feed
- Permalink
Hi Grayson. Assuming you are working in ArcGIS Pro, you might want to start by looking at these topics.
Vary symbology by size—ArcGIS Pro | Documentation
Vary symbology by color—ArcGIS Pro | Documentation
Edie
- Mark as New
- Bookmark
- Subscribe
- Mute
- Subscribe to RSS Feed
- Permalink
Great, thank you! I have everything working except as time progresses, my data points accumulate labels. I only want the label to appear at the corresponding time, and then disappear. Do you have any recommendations?
- Mark as New
- Bookmark
- Subscribe
- Mute
- Subscribe to RSS Feed
- Permalink
Grayson, have you set up time on the layer? Get started with time—ArcGIS Pro | Documentation
When you do that, if you use the time slider, as you progress through time, points that are not within the time showing on the map won't display meaning that they won't be labeled. So as you move through time, points within your defined time range will display and be labeled, then disappear and be replaced by new points displaying for the next time step. If it is the same set of static points with values changing over time, the labeled values should only display those valid for the current time step.
Check out the Configure time in a map help starting with Set the time properties on data—ArcGIS Pro | Documentation and Visualize temporal data using the time slider—ArcGIS Pro | Documentation
Pay close attention to the visible time span:
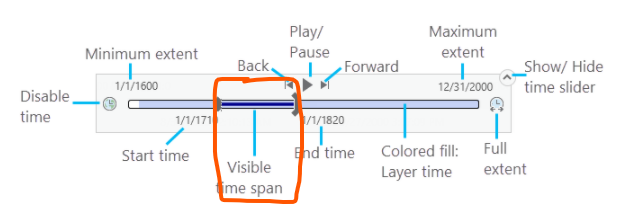
Hope this helps!
- Mark as New
- Bookmark
- Subscribe
- Mute
- Subscribe to RSS Feed
- Permalink
Thanks so much, this is exactly the help I was looking for! Thanks again!