GIS Life Blog - Page 5

cancel
Showing results for 
Show  only  | Search instead for 
Did you mean: 

Latest Activity

(463 Posts)
BernSzukalski
Esri Frequent Contributor

Hurricane Harvey, currently a Category 2 storm, is predicted to gain strength and become a Category 3 storm sometime today, as it makes landfall in the vicinity of Corpus Christie, Texas. Landfall is currently expected late tonight, or early Saturday morning. So far seven Texas counties have ordered mandatory evacuations of many thousands of residents in low-lying areas. The last Category 3 storm to hit the U.S. was Hurricane Wilma in October, 2005, when it reached landfall in Florida.

Esri's Disaster Response portal provides live maps and feeds to complement your mapping, as well as assistance programs to help meet your needs.

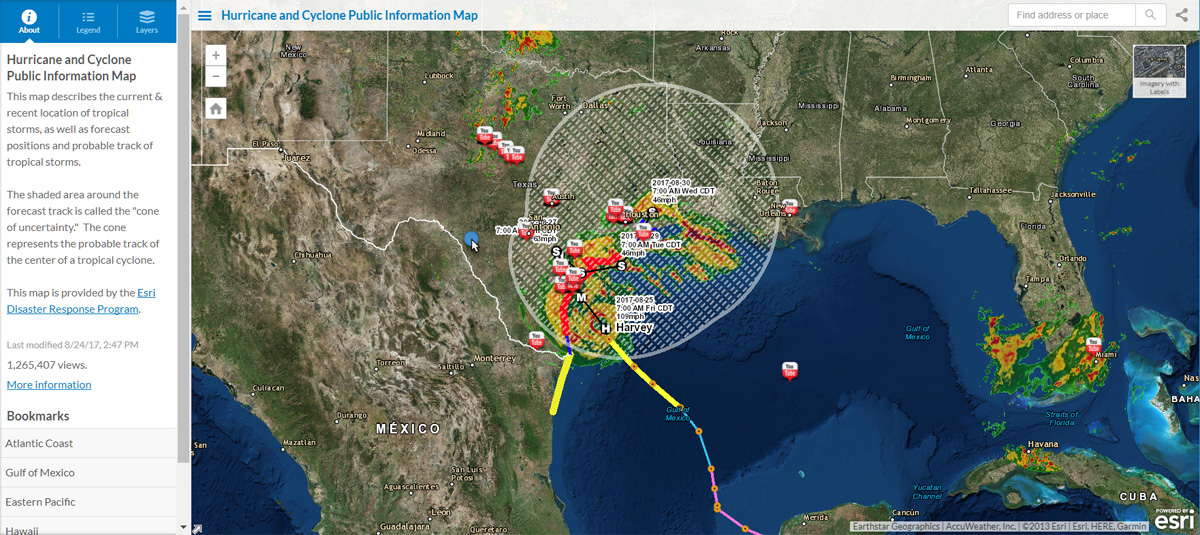
The Hurricane and Cyclone Public Information Map includes live feeds from the Living Atlas, along with the current and forecast hurricane position and strength. 

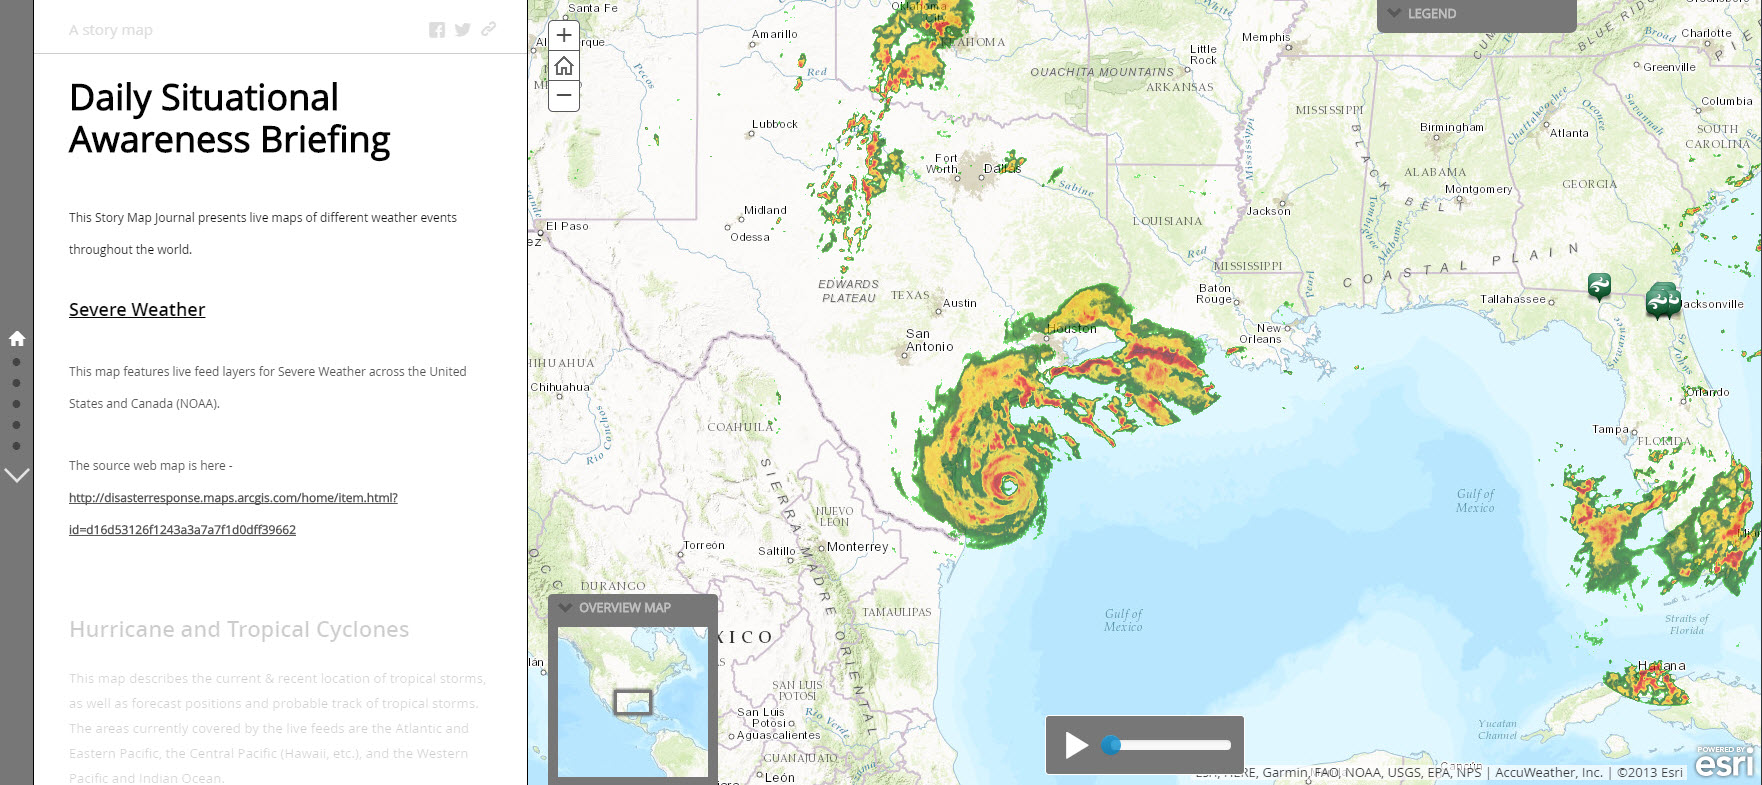
Daily Situational Awareness Briefing is a Story Map Journal that shows severe weather, hurricanes and cyclones, earthquakes, and more. The link will open the story map in autoplay mode, cycling through each of the journal sections.

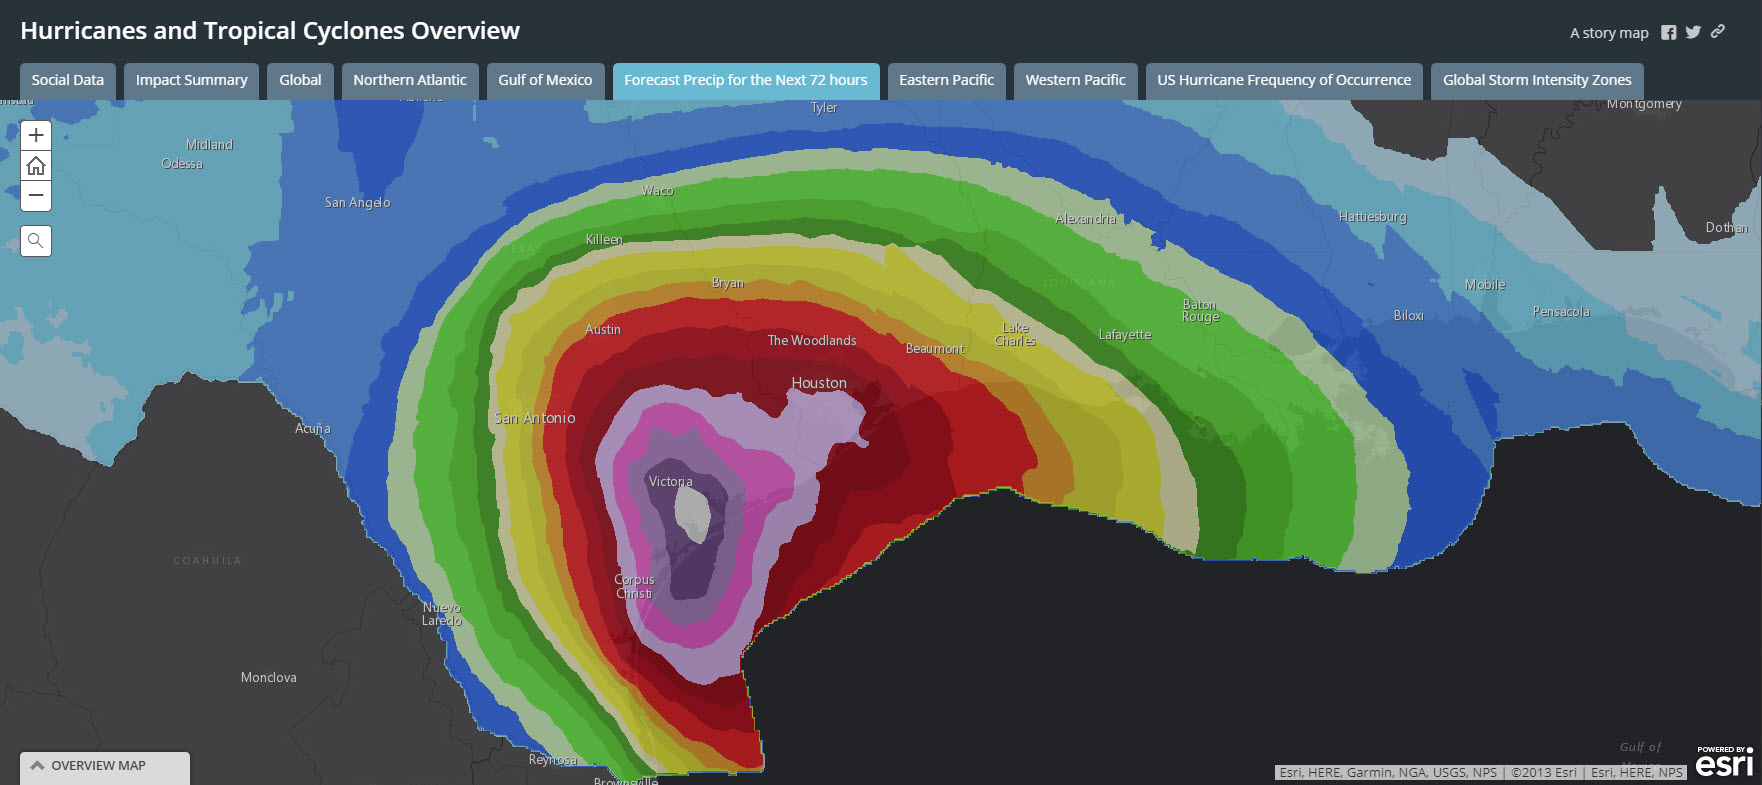
Hurricane and Tropical Cyclones Overview is a Story Map Series that "binds" together multiple apps about the storm. The series includes an Impact Summary of potential storm surge impacts and forecast precipitation over the next 72 hours.

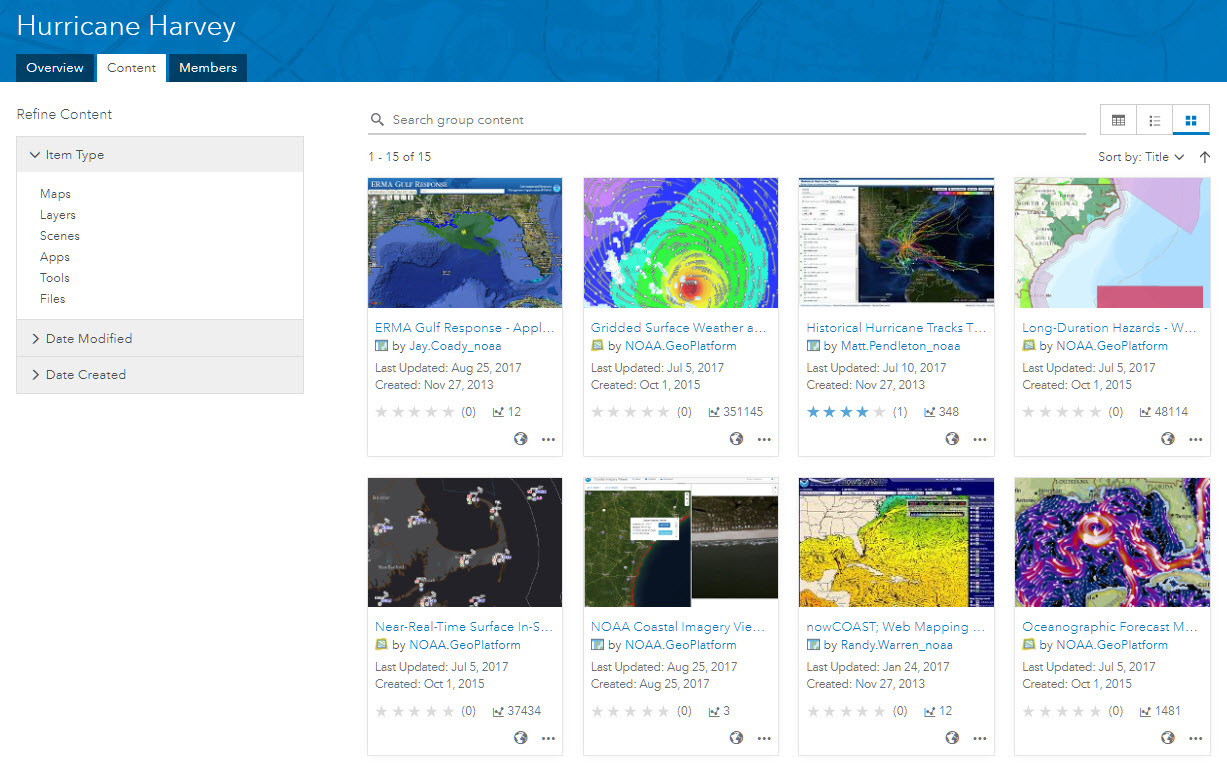
NOAA publishes a group of maps and layers about Hurricane Harvey.

Other apps and layers can be discovered by searching ArcGIS online.

Disaster ResilienceStory Mapshttps://community.esri.com/community/public-safety?sr=search&searchId=2074f727-f7b8-4853-8060-ae2c5b...

more
3 0 1,622
BernSzukalski
Esri Frequent Contributor

Recently someone asked me for help moving from ArcMap to Pro, so I solicited colleagues at Esri for information and useful links. I totally understand the challenge. If you're like me, when you just have to get something done your go-to app just still might be ArcMap. It's a powerful, dependable, and capable desktop GIS, that will live on for a very long time. But there's plenty of reasons to migrate to Pro now.

You bet it takes a bit of time and relearning, and perhaps leaving the comfort of your existing workflows and well-worn workpaths. But the benefits are large, with many new features and capabilitiesnot to mention online integration. All of these make it a must-learn for every GIS professional.

While I can admit that I'll still be cranking up ArcMap often for well-worn workflows, I will also admit that I'm trying hard to find the time to relearn existing workflows in Pro, and learn new ones. And when I do, I'm pleasantly surprised. And the comments I get from the many users I interact with underscore the same, and that it's time to let go of the security of the ArcMap blankie...

So, here's a list of useful resources that will help you cross over to the other side. All are free, and freely available for you, and your colleagues, to use. Let's move on!

Terminology Guide:

http://www.esri.com/library/brochures/pdfs/arcgis-pro-terminology-guide.pdf


Quick Start tutorials:

http://pro.arcgis.com/en/pro-app/get-started/pro-quickstart-tutorials.htm

Quick start tutorials on YouTube:

Introducing ArcGIS Pro - YouTube 


Videos and Know Before You Pro:

http://www.esri.com/en/arcgis/products/arcgis-pro/migrate

Migrate existing content into Pro:

http://www.esri.com/videos/watch?videoid=3894&isLegacy=true&title=migrate-your-content 

Esri Training: Going Pro: ArcGIS Pro Essentials for ArcMap Users

https://www.esri.com/training/catalog/590901ecdb250232197d2326/going-pro:-arcgis-pro-essentials-for-... 


Blog posts:

https://blogs.esri.com/esri/arcgis/2015/08/14/migrate-your-content-into-arcgis-pro/

https://blogs.esri.com/esri/arcgis/2017/08/09/going-pro-your-guide-to-getting-up-and-running-with-ar...

http://communityhub.esriuk.com/geoxchange/2017/6/15/helpful-tips-and-tricks-for-transitioning-from-a...


Help doc:

http://pro.arcgis.com/en/pro-app/get-started/migrate-to-arcgis-pro.htm

A story map compiling 11 free Pro lessons:

https://esripm.maps.arcgis.com/apps/MapSeries/index.html?appid=e6ab98e5449d4a71a900c0c41a2c7220 


YouTube migration video:

https://www.youtube.com/watch?v=FdlR85ME6to&list=PL1U1yOIVhnz8-m-j0yOYEBImsDjR4EPqh&index=5


Model builder migration:

http://pro.arcgis.com/en/pro-app/help/analysis/geoprocessing/modelbuilder/modelbuilder-changes-in-ar...


Misc:

http://pro.arcgis.com/en/pro-app/help/projects/drawing-behavior-in-arcgis-pro.htm


Python migration:

http://pro.arcgis.com/en/pro-app/arcpy/get-started/python-migration-for-arcgis-pro.htm

If you have any more useful resources, comment and I'll add them to the list. Thanks!

more
7 3 2,079
BernSzukalski
Esri Frequent Contributor

From NASA.gov:

On Monday, August 21, 2017, all of North America will be treated to an eclipse of the sun. Anyone within the path of totality can see one of nature’s most awe inspiring sights - a total solar eclipse. This path, where the moon will completely cover the sun and the sun's tenuous atmosphere - the corona - can be seen, will stretch from Salem, Oregon to Charleston, South Carolina. Observers outside this path will still see a partial solar eclipse where the moon covers part of the sun's disk. 

With all eyes (properly protected, of course) on the solar eclipse tomorrow, this is a huge event that should be the showcase for many GIS organizations, putting their best foot forward with amazing publicly accessible apps that provide information about the eclipse and showcase the best maps and apps tradecraft that GIS organizations can muster. 

This evening I took a quick peek and found the good, and also the "meh," with a collection of apps that have appeared covering the amazing event. You can search for your own and decide for yourself which you think are the best. I have my list of the good, the bad, the ugly...

The first I found is a Story Map Cascade by Esri's Mike Zeiler titled Seeing The Great American Eclipse.

View the Story Map

As you've come to expect from the Story Maps featured apps, it's a great example of a Cascade with interesting graphics and maps that help tell the story of the eclipse.

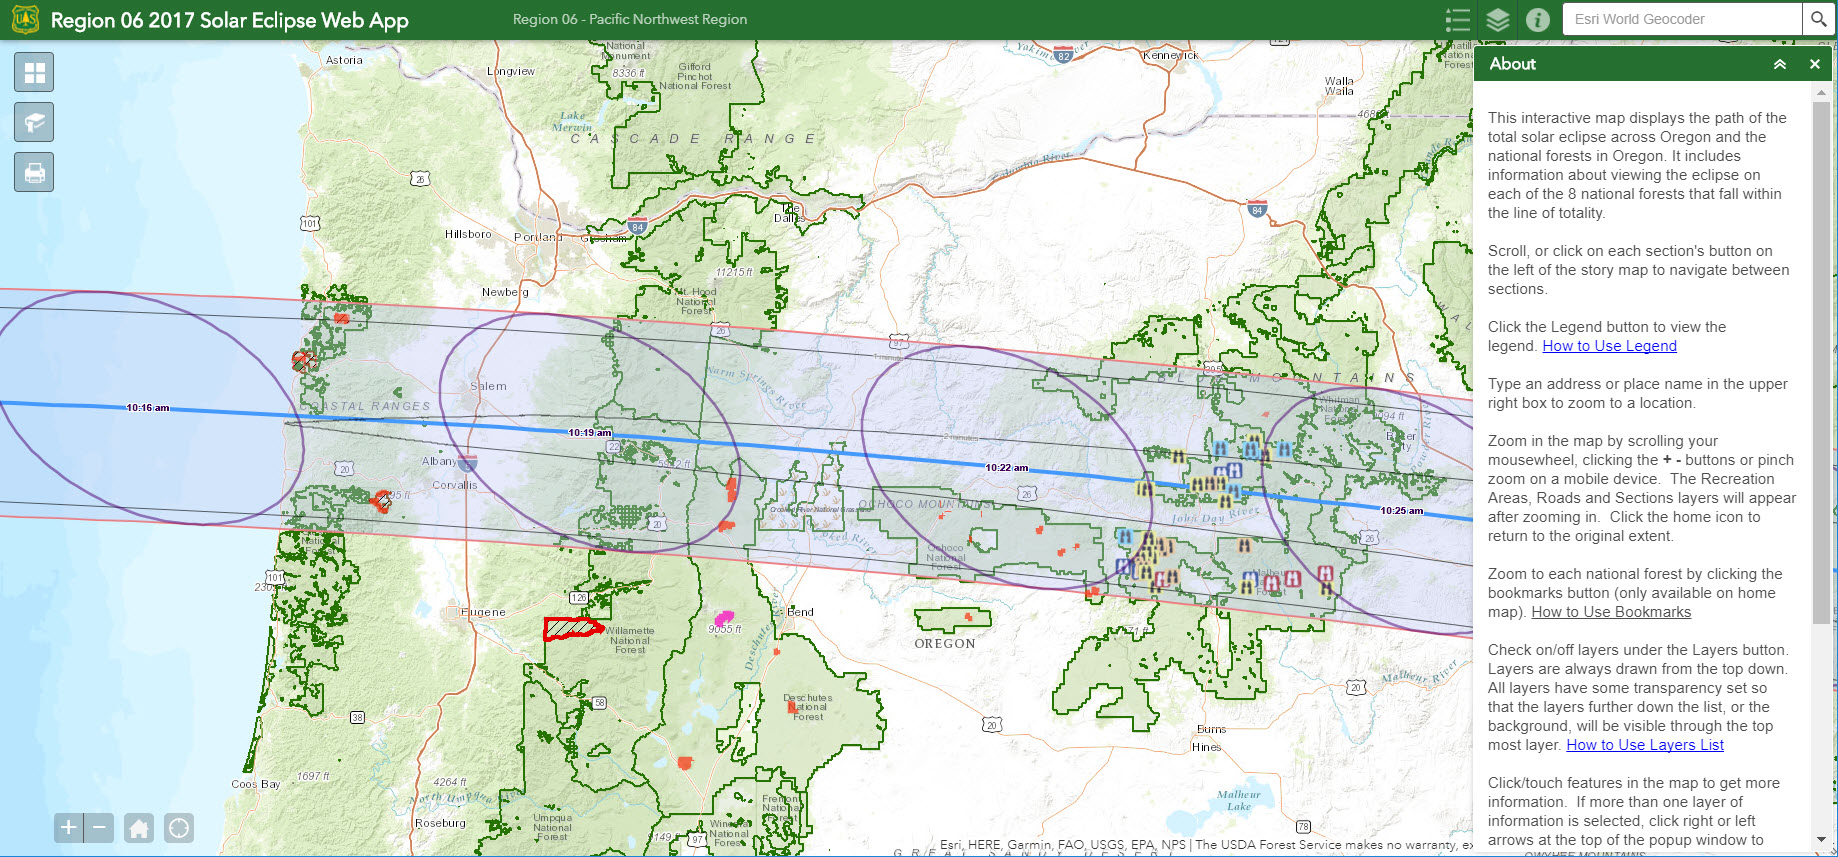
The next app I found, authored using Web AppBuilder, was by the USFS Pacific Northwest Region. It displays the path of the total solar eclipse across Oregon and the national forests in Oregon. It provides information about viewing the eclipse on each of the 8 national forests that fall within the line of totality. 

https://usfs.maps.arcgis.com/apps/webappviewer/index.html?id=14a89446eb7746db867e15748e30478a

View the app

For better or for worse, I find this is a typical "GIS-centric" web mapping application, with tons of layers, unconfigured pop-ups (The Horror!), and a long read in the About dialog. But's it's certainly a comprehensive collection of authoritative content. A great public app? Maybe not so much... A great collection of useful resources that savvy viewers can pick apart? For sure...

The City of Salem, Oregon, features a Story Map on their Salem home page about the Eclipse. It's nicely branded on their featured gallery, and while it might not win a creativity award, it's a solid example of a "bread and butter" app that shows parks where the eclipse can be viewed, with information about the available facilities at each location - a true public service app.

View the app

If you're thinking that the best fishing is during the eclipse, this Story Map Journal from Idaho Department of Fish and Game shows you where the best fishing spots are if you totally want to fish during totality.

View the Story Map


You can view many more examples by searching ArcGIS Online and arrive at your own conclusions as to which ones are great examples of app-craft, and which could use a little extra work. How does your app compare? I'll take a closer look at these in a later post. Add your comments, and let me know what you think.

(*Note that opinions are my own, and not those of Esri.)

Story MapsWeb AppBuilder for ArcGIS ArcGIS Configurable Apps 

more
1 0 669
BernSzukalski
Esri Frequent Contributor

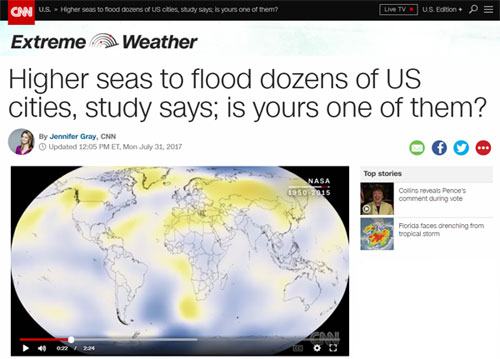
This morning over breakfast I was browsing the news on my tablet and found this article on climate change on the CNN site.

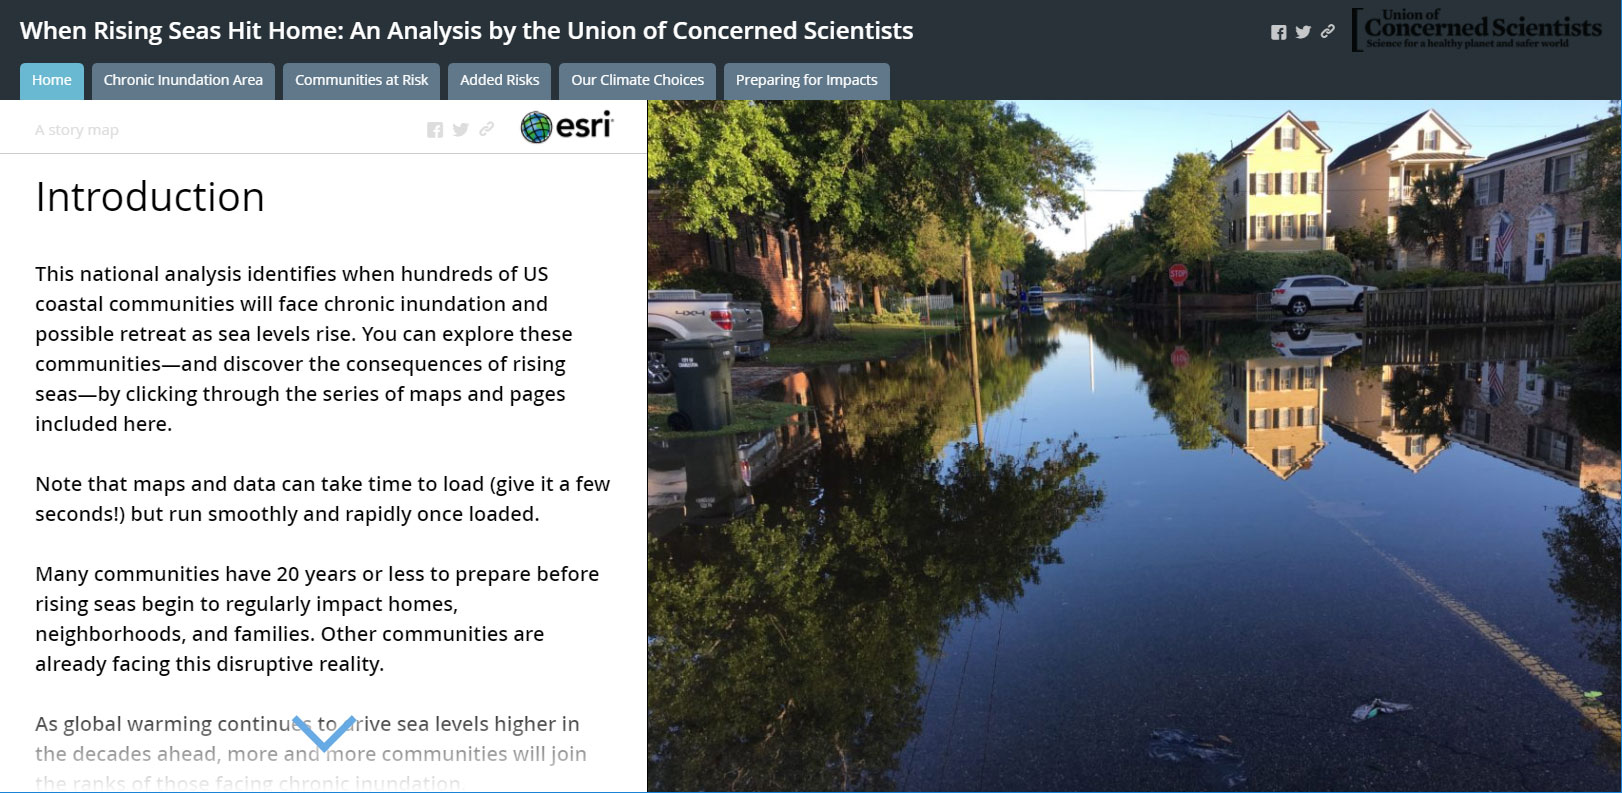
The articles links to a study by the Union of Concerned Scientists, released last Wednesday, listing the cities that will be inundated by sea level rise and citing other climate related issues affecting coastal communities. The study includes a link to When Rising Seas Hit Home: An Analysis by the Union of Concerned Scientists—a Story Map, and also our Map of the Day today.

The app presents the results of GIS analysis as a series of live maps, bound together in an interesting way and all contained within a Story Map Series. The Map Series uses the tabbed layout, one of three options you can choose from (others options are the bulleted and side accordion layout). Each of the Map Series tabs includes a Story Map Journal to help tell the story. The viewer works across the tabs from left to right, with each tab revealing a Map Journal that is viewed from top to bottom. This pattern of combining Map Journal within a tabbed Map Series is especially effecting.

What I like about this map

There's lots that I like about this well-crafted story. It has an introductory section as well as a conclusion. It uses a compelling title to help lure the viewer into the story. And the legends, driven directly from the web map, use layer names and are presented in a way that helps the viewer make sense of what they see.

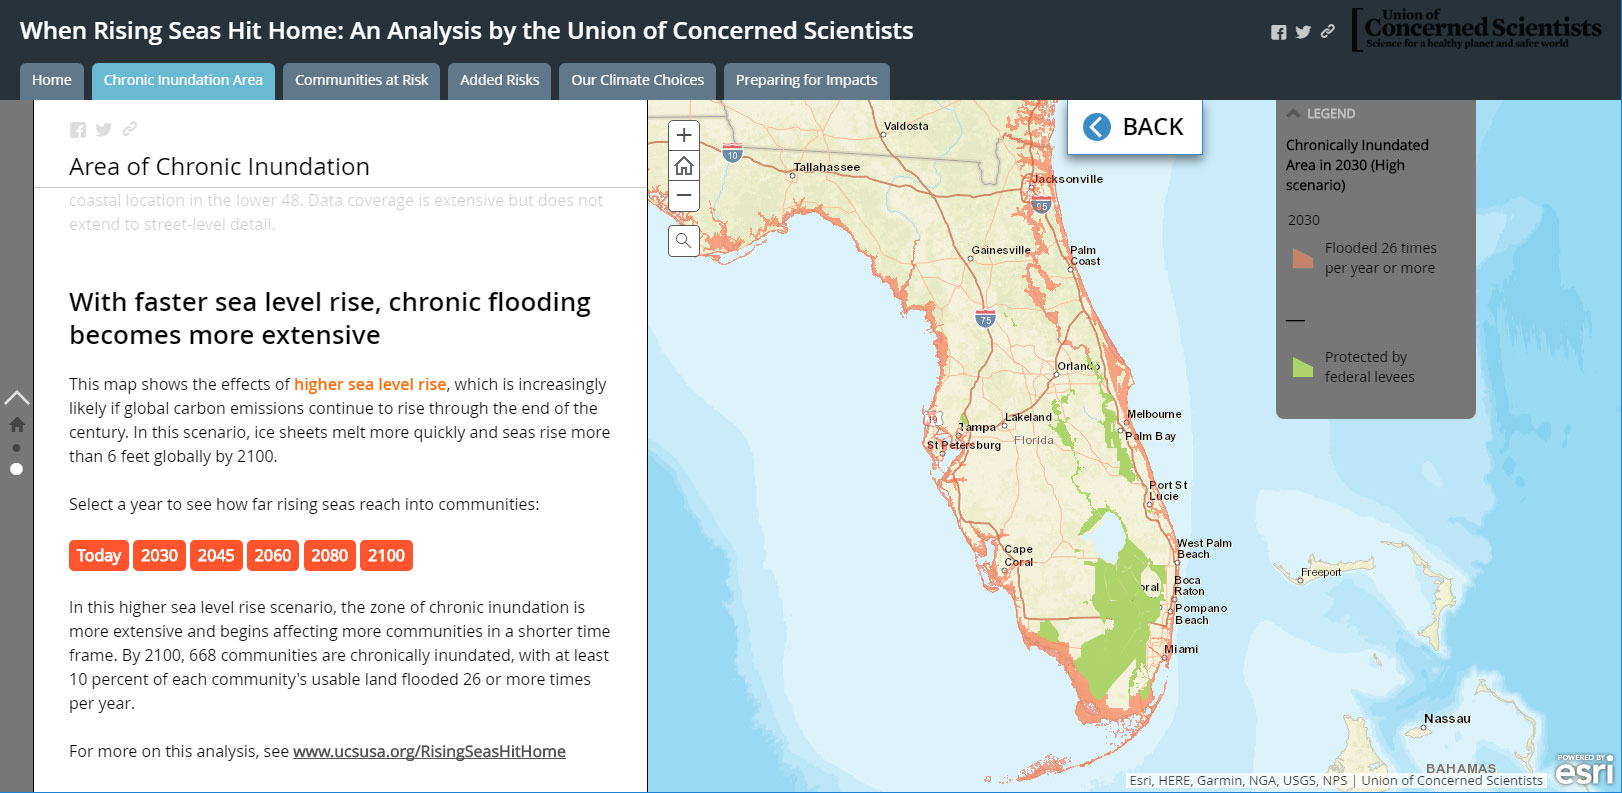
It also takes advantage of color and Main Stage actions in the Map Journal side panel to reveal the story, and allow the viewer an opportunity to explore. For example, in the Chronic Inundation Area tab, the third section in the Map Journal uses text color and button color to link the side panel to what you see on the map. Main Stage actions are behind the buttons, changing the content on the Main Stage to show rising sea level over time.

All of this makes this a solid Story Map Series, and a great example of how you can use story maps to deliver reports.

Climate ResilienceEnvironment and Natural ResourcesStory MapsSciences

more
2 1 609
BernSzukalski
Esri Frequent Contributor

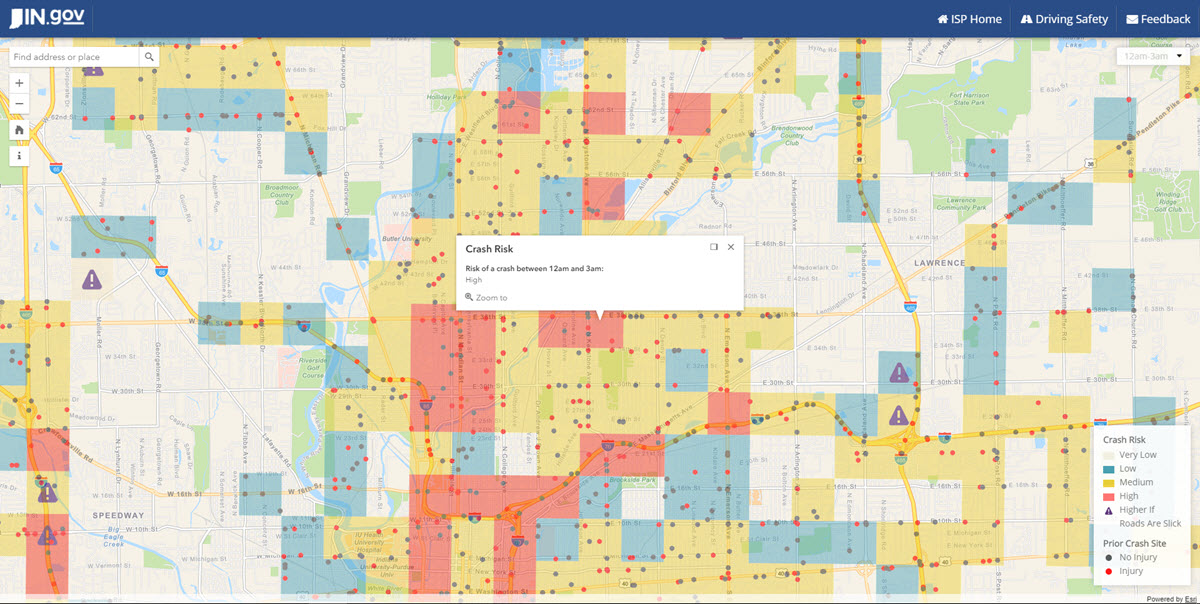
Accidents happen, with more than six million crashes occurring annually on roads in the United States. But what if a web app could show you, on a map, where and when the current traffic crash risk is high in your community? Would you change the route you take or be more cautious? That web app is a reality for Indiana residents, who can visit the Daily Crash Prediction Map to find out the accident risk on roads throughout the state for the current day.

The interactive app, compiled and deployed using Esri technology, shows the probability of crashes across the state by time of day, using a predictive algorithm. The machine learning algorithm uses historical crash data, road conditions and characteristics, annual traffic volumes, population and employer information, gas prices, position of the sun, time of year and day, and other variables to predict the probability of a crash. 

Read more about the app in Does Danger Lie Up the Road in the latest ArcWatch.

Public Safety‌ https://community.esri.com/community/transportation?sr=search&searchId=18542516-cb7c-46d0-942b-b7bfb... https://community.esri.com/groups/departments-of-transportation?sr=search&searchId=c9894df6-ccf2-402...

more
1 0 592
BernSzukalski
Esri Frequent Contributor

The World Imagery Firefly basemap is currently in beta, but available for anyone to use. You can view a brief intro about it from the 2017 Esri User Conference plenary here: 

Esri UC 2017: ArcGIS Online—Did You Know DYK? - YouTube 

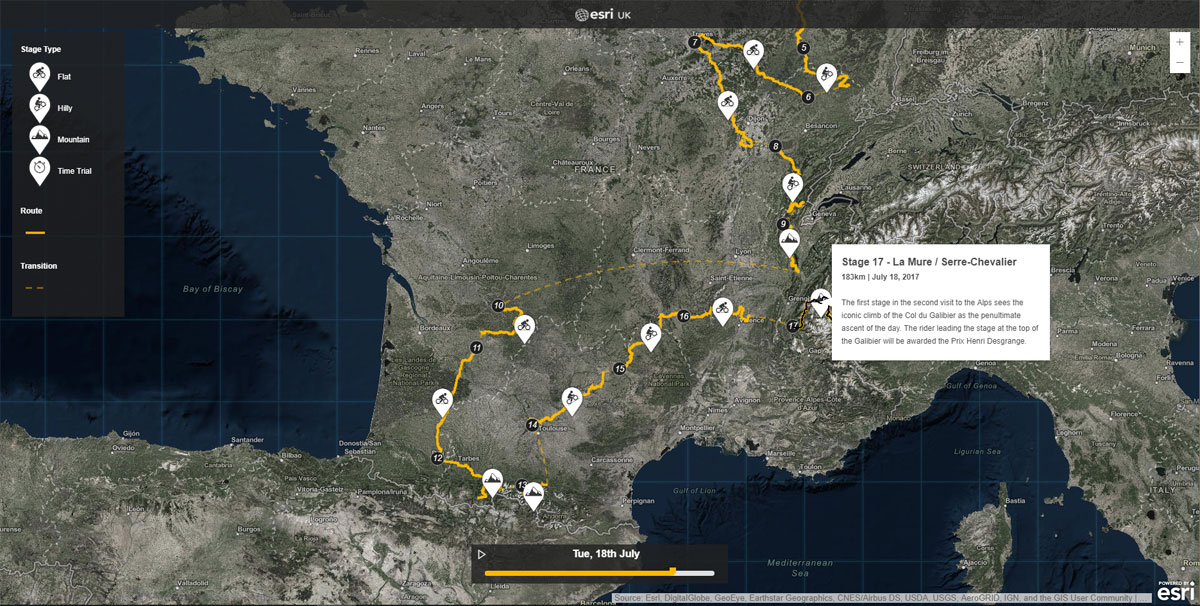
Interestingly enough, while it's still in beta and pretty new, it's already been used by Esri U.K. for an app that appeared in the DailyMail online. The full app is shown below. 

You can see that Firefly is grayscale when zoomed out, but you still get the texture, context, and drama of imagery without competing with other layers. Zoom in, and you will see the basemap becoming increasingly more colorized until it reaches full color saturation.

For being an early adopter of the Firefly basemap, this app from Esri U.K. earns our Map of the Day.

Learn more by viewing World Imagery Firefly: imagery for thematic maps.

ArcGIS OnlineLiving Atlas of the World Discussion Group

more
3 2 720
BernSzukalski
Esri Frequent Contributor

Earlier today someone asked me about a way to shorten a URL to an app hosted in their ArcGIS organization. Not only did they want to shorten it, they wanted to create a custom shortlink that would be easier to remember. 

I found a list of 9 URL Shorteners to Shorten Long Links and tried a couple of them. Most just shorten a link - this is good, but results in jibberish that's good for copy/paste, but not much else. One of them (which I did not try) offers domain-based short URLs for a fee.

But a reasonable alternative, and also one that's free, is from Tiny URL. While not quite a total custom URL, or one that is based on your domain, it does offer a solution for something that's easy-to-remember.

I took this impossible to remember and lengthy URL:

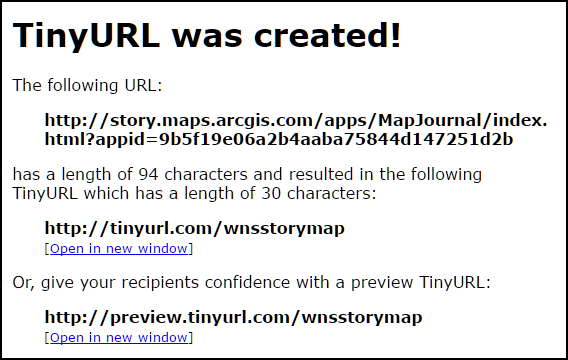
http://story.maps.arcgis.com/apps/MapJournal/index.html?appid=9b5f19e06a2b4aaba75844d147251d2b 

And ran it through TinyURL to create something I could remember. I tried a couple of strings which were already taken, but found one that wasn't and settled on this as the short URL:

Note that it also includes a preview, just in case someone might be suspicious and wants to view the expanded URL before opening.

Try them out:

http://tinyurl.com/wnsstorymap 

http://preview.tinyurl.com/wnsstorymap

Note that this isn't an endorsement, but hopefully it's something useful. Let me know if there are others you find.

more
8 0 36.1K
BernSzukalski
Esri Frequent Contributor

Some called it "the day the internet died" when a massive failure at a key Amazon east coast facility caused major disruption of some sites, including ArcGIS Online, for several hours.

According to Amazon:

The Amazon Simple Storage Service (S3) team was debugging an issue causing the S3 billing system to progress more slowly than expected. At 9:37AM PST, an authorized S3 team member using an established playbook executed a command which was intended to remove a small number of servers for one of the S3 subsystems that is used by the S3 billing process.

Unfortunately, one of the inputs to the command was entered incorrectly and a larger set of servers was removed than intended.

For some it was an inconvenience, for others a cause for re-thinking their cloud backup plan. ArcGIS Online, including license activation for ArcGIS Pro and other premium apps, was impacted for several hours. But Amazon rectified the problem, everything quickly came back online again.

How to monitor ArcGIS Online system health

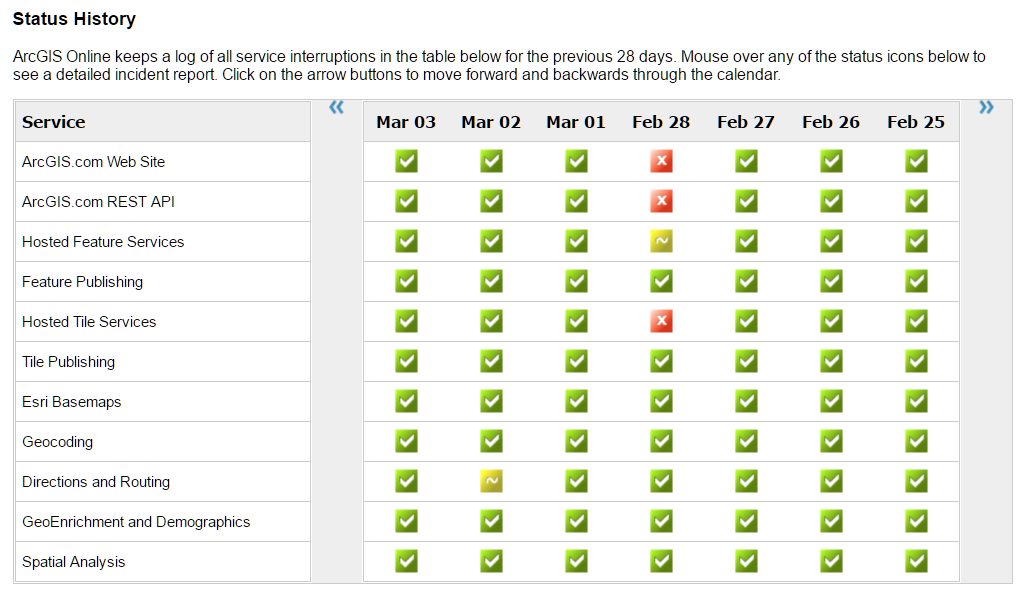
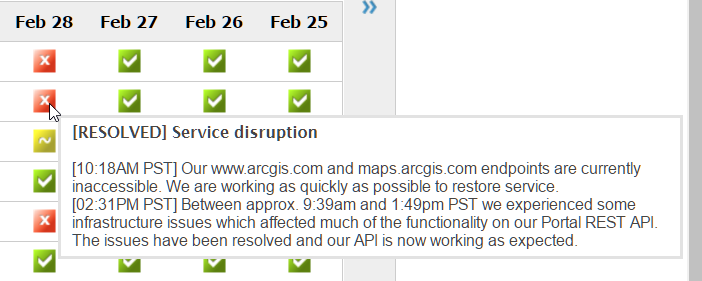
The ArcGIS Online Health Dashboard publishes the latest information on service availability. Here's how it looked during the Amazon outage:

Hovering over any icon provides the latest status and information.

While the event was unusual, you may want to subscribe to the RSS feeds to be notified of any issues. Subscribe to any individual RSS feed, or subscribe to All, to be notified of any service interruptions.

More information on service status as well as other service and security considerations can be found at Trust ArcGIS.

more
3 0 809
BernSzukalski
Esri Frequent Contributor

By default, all story maps include an Esri logo, with a link to the Esri website, located somewhere in the header or opening section. Also by default the text string "A story map" is included in the header, with a link to the Story Maps website. A good practice, especially if you are authoring story maps that represent your organization, is to replace the Esri default logo, text, and links with a logo and links of your own.

Here's a nice Story Map Tour from the Commonwealth of Kentucky.


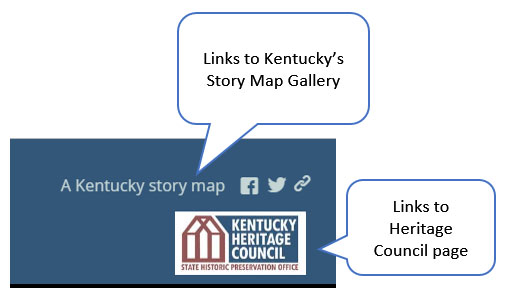
If you take a closer look at the header, you'll see a custom logo, tagline, and links have been added.

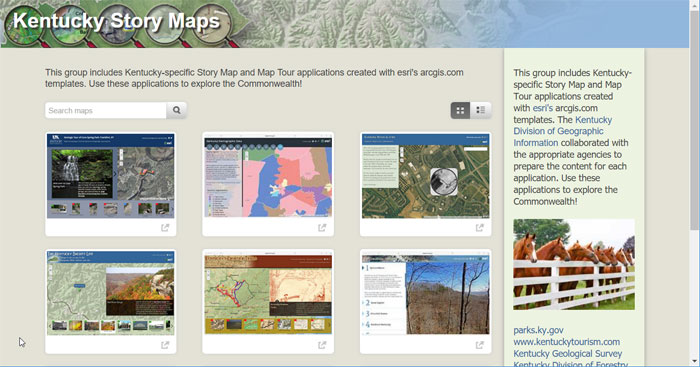
The logo links to a web site, but what I really like is that the string "A Kentucky story map" links to a gallery of other story maps, created using a group gallery app. Here's the gallery:

This is a good way to let user know about more story maps they might be interested in, from any other story map.

For more information, see Add your organization logo and links to your story maps.

more
2 0 583
BernSzukalski
Esri Frequent Contributor

The list never seems to stop, here's two more things that you can do with Story Maps. The current list of 10 is here:

Ten things you didn’t know you could do with Story Maps | ArcGIS Blog 

These will be added soon...

A Wedding Invitation

This Story Map Series (side accordion layout) is actually a wedding invitation, including everything from the event date, venue, and travel information to get there. Congrats to Jose and Segio!


A Web Page

Here are two examples of a Story Map Cascade as a web page. This first one from the International League of Conservation Photographers (ILCP). The header is fixed, the Cascade was embedded using an iframe.

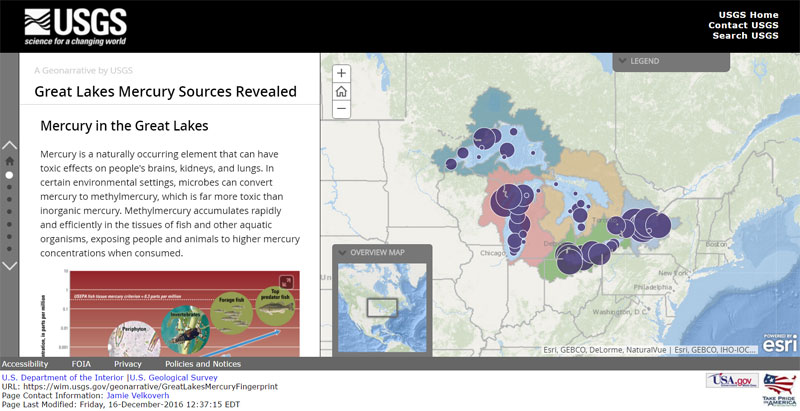
This second example is from the USGS,and uses a standard USGS header and footer. It also embeds the Cascade using an iframe. Check out the page source to see how easy and simple this is. Great idea!

more
2 0 4,023
111 Subscribers