- Home
- :
- All Communities
- :
- Products
- :
- Geoprocessing
- :
- Geoprocessing Questions
- :
- Re: Zero problem in interpolation
- Subscribe to RSS Feed
- Mark Topic as New
- Mark Topic as Read
- Float this Topic for Current User
- Bookmark
- Subscribe
- Mute
- Printer Friendly Page
Zero problem in interpolation
- Mark as New
- Bookmark
- Subscribe
- Mute
- Subscribe to RSS Feed
- Permalink
Hi everyone,
i am trying to interpolate the seabed sediment gravel content and i experience some problems in the cross-validation results, like the slope of the graph predicted vs. measured is not bigger than 0.6 with some hi errors. However, analyzing the layer obtained, this one seems good. I think that the problem it maybe related with the high number of zeros, 92 in 226 samples. I already transform the variable with square root, 4th root, log (x + 0.0001), logit (x + 0.0001) and normal score transformation included in ArcGIS, but the problem persists. I already make an interpolation for other variable quite similar to this using the logit, namely the fines content, and it went well. I´m asking why i could not make a good interpolation in the case of the gravel content? Maybe the large number of zeros? Or it could be related to the inherent variability to this variable vs. sampling resolution?
Someone could help me with this problem?
Thank you in advance.
- Mark as New
- Bookmark
- Subscribe
- Mute
- Subscribe to RSS Feed
- Permalink
remove the zeros if they are invalid data points. Trying to go to heroic lengths to get an interpolation is not really the way to go. Can you explain why a spatial pattern would be made better by taking the 4th root and doing some log operations? can you post an image of the spatial pattern of the data you are working with? It could very well be that it is the distribution that is causing so many problems.
- Mark as New
- Bookmark
- Subscribe
- Mute
- Subscribe to RSS Feed
- Permalink
Hi Dan, thank you for the help.
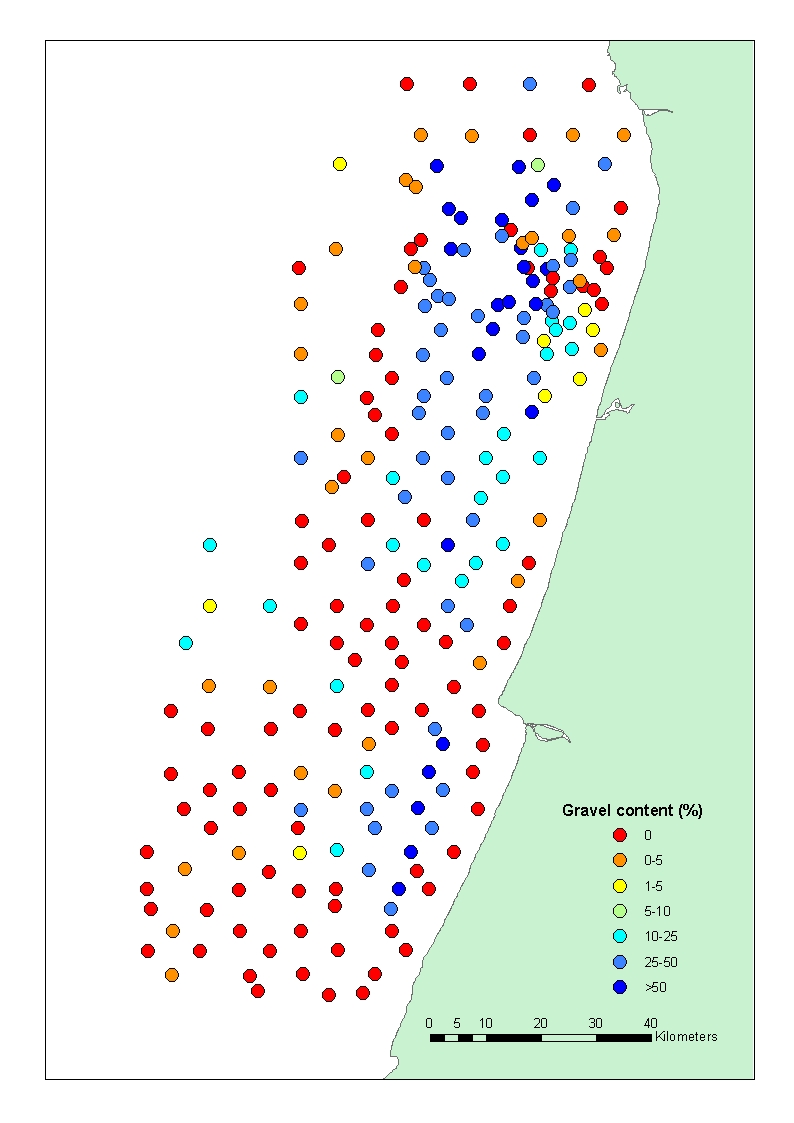
The zero points data are real and valid measurements. I try a wide range of transformations aiming to normalize the data because is skewed, but this seems to be impossible due to the high number of zeros. I post a figure with the spatial distribution of my data.
- Mark as New
- Bookmark
- Subscribe
- Mute
- Subscribe to RSS Feed
- Permalink
I am not clear why you want to normalize the data in the first place. If those observations are valid, what are the interpolation results for your given interpolator. How can you explain the presence of observation points with 50 %gravel being right beside points with 0% gravel? This suggests to me a feature in the landscape/waterscape that is causing/or has caused removal of the fines or deposition of the coarse. It would be interesting to put these data into context with what is actually on the seabed, what the seabed topography looks like and how these factors relate your observations
- Mark as New
- Bookmark
- Subscribe
- Mute
- Subscribe to RSS Feed
- Permalink
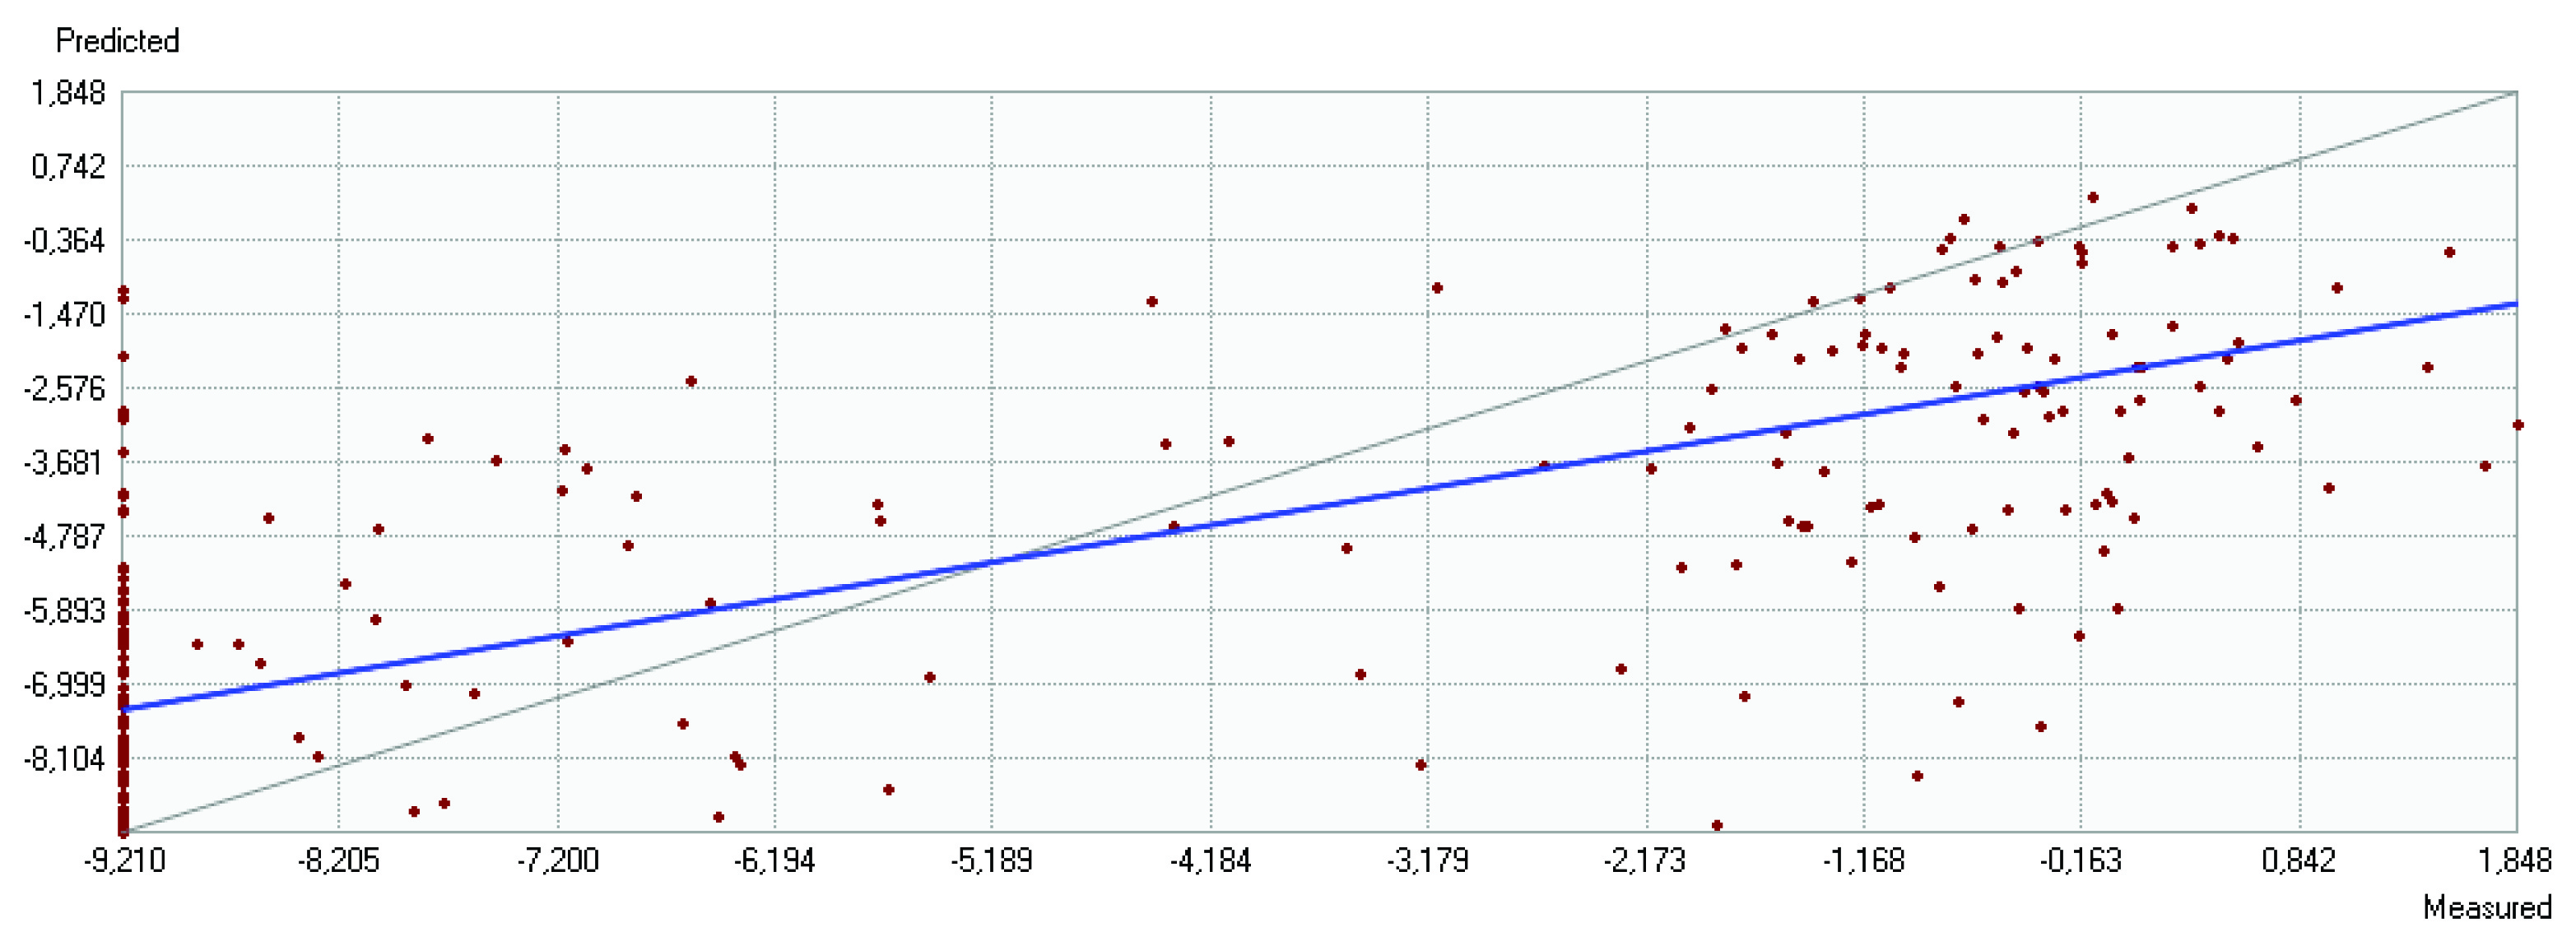
I'm using kriging, so i think that this works better with normal distributed data. Am i wrong? As i told before, i already interpolate the fines content and it´s easy to understand its spatial distribution, high values in deeper areas and in front of major rivers. However, in the gravel content case i have some difficulties to understand. I believe that the high values correspond to historical deposits of gravel. The topography is quite monotonous, as you can see in the figure (now with the bathymetric lines ranging from 20 to 200 m), the only relevant feature is the rock outcrop highlighted with the arrow. One of my questions is that if i could present in a thesis a surface with this cross validation results (graphic bellow)? I could not make it much better, i think due to that distribution values (0% near to >50%).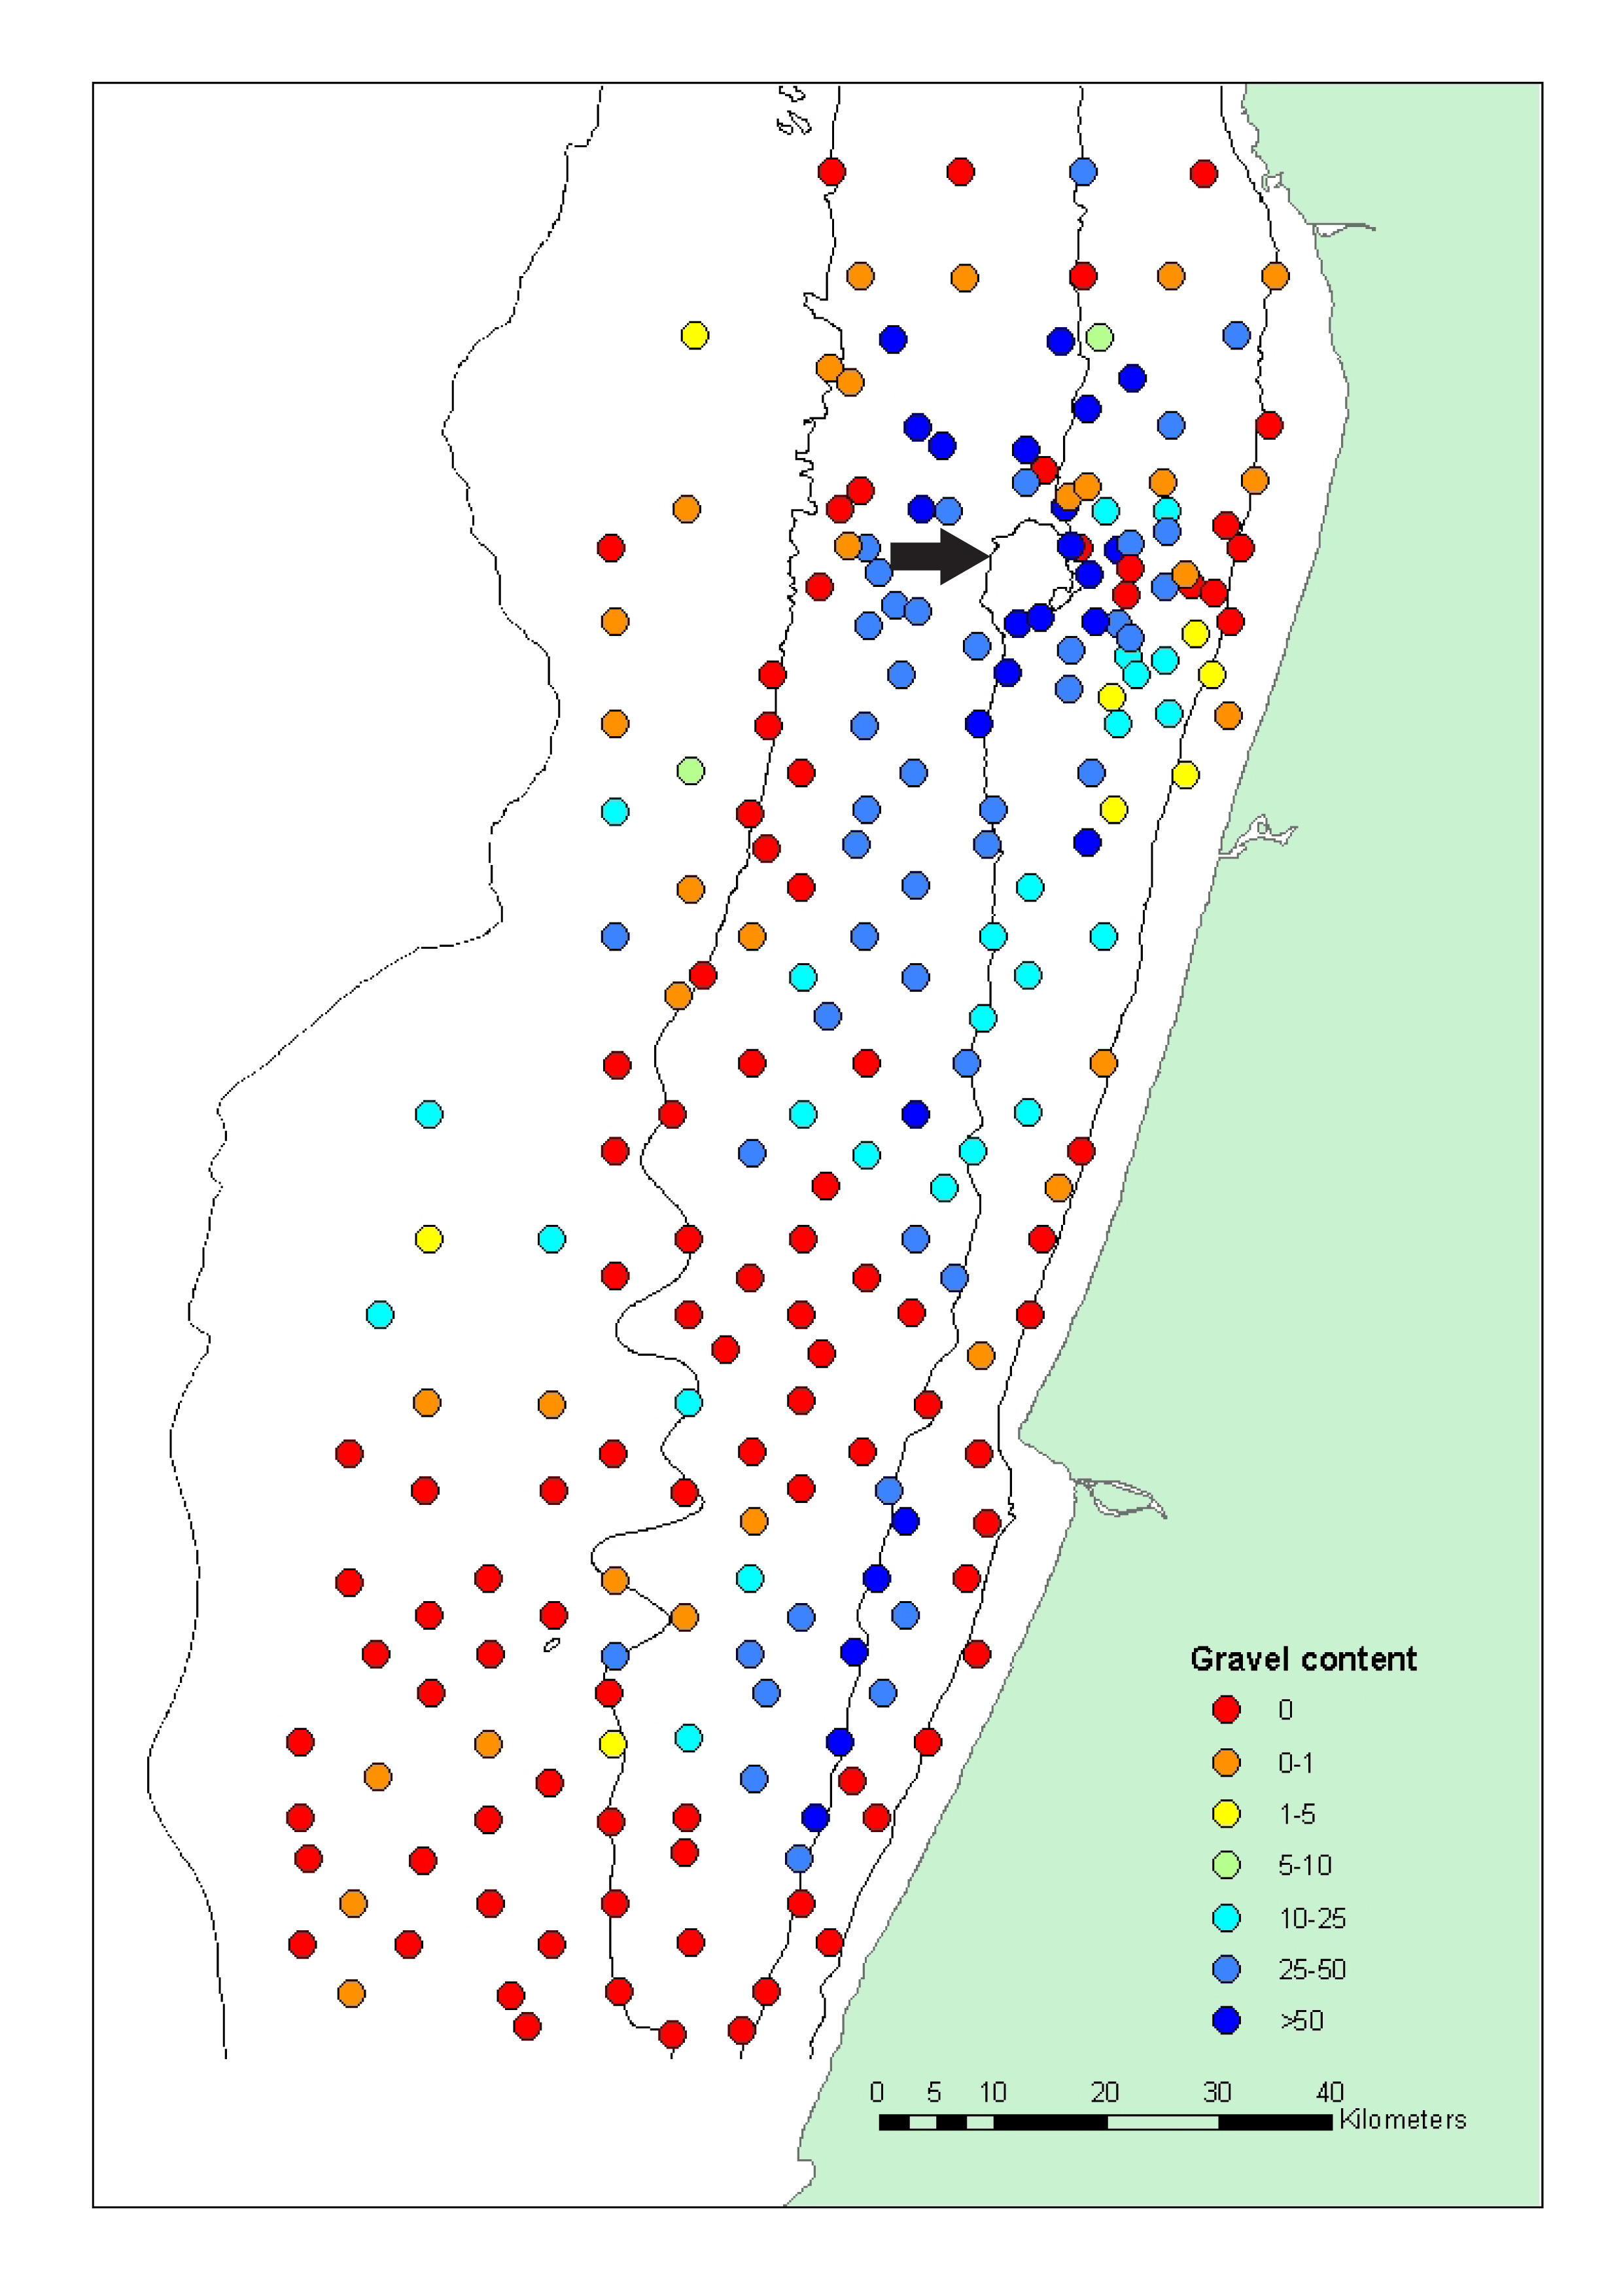
- Mark as New
- Bookmark
- Subscribe
- Mute
- Subscribe to RSS Feed
- Permalink
I forget to mention that in the graphic the values are in the logit scale.
- Mark as New
- Bookmark
- Subscribe
- Mute
- Subscribe to RSS Feed
- Permalink
When you say the % fines looks good, what do you mean? Are you saying that you separated the fines distribution out from the total and it doesn't include the % gravel?
Also, the rock outcrop suggests to me that there is more erosion and removal of the fines and it is not a depositional process, but you know the area so I will leave that to your interpretation
- Mark as New
- Bookmark
- Subscribe
- Mute
- Subscribe to RSS Feed
- Permalink
I separate the sediment into three major components: fines, sand and gravel. For now, i'm trying to interpolate fines and gravel content separately. I agree with you that near to this rock outcrop exists more removal and this is showed by the low content of fines in that area, but in some of this sites this not correspond, as expected, to high % of gravel. It seems quite strange the absence of gravel near of some location with high content.
- Mark as New
- Bookmark
- Subscribe
- Mute
- Subscribe to RSS Feed
- Permalink
I view sediments as either
total = %silt/clay, %sand, % gravel (excluding organic matter)
--- more of a geomorphological perspective
or
total = %silt, % clay, % sand gravel and OM removed prior to grain size analysis,
--- more of a soil science perspective
which are you using or are you using something different.
You could just make a Voronoi diagram from the sample points and provide a classification scheme (ie sandy gravel, silty gravel, silty clay) rather than trying to interpolate a surface from the observations.
- Mark as New
- Bookmark
- Subscribe
- Mute
- Subscribe to RSS Feed
- Permalink
It´s in the geomorphological point of view, but i named fines to the <0.063 mm particles, representing the same as the %clay/silt. I want to obtain a smooth sediment map and the respective error, for this i am doing the kriging. I do not want to make a classification map,