Turn on suggestions
Auto-suggest helps you quickly narrow down your search results by suggesting possible matches as you type.
Cancel
- Home
- :
- All Communities
- :
- Products
- :
- Geoprocessing
- :
- Geoprocessing Questions
- :
- What are the weights in the semi-variogram map in ...
Options
- Subscribe to RSS Feed
- Mark Topic as New
- Mark Topic as Read
- Float this Topic for Current User
- Bookmark
- Subscribe
- Mute
- Printer Friendly Page
What are the weights in the semi-variogram map in Geostatistical wizard?
Subscribe
09-10-2013
01:59 PM
- Mark as New
- Bookmark
- Subscribe
- Mute
- Subscribe to RSS Feed
- Permalink
Hi,
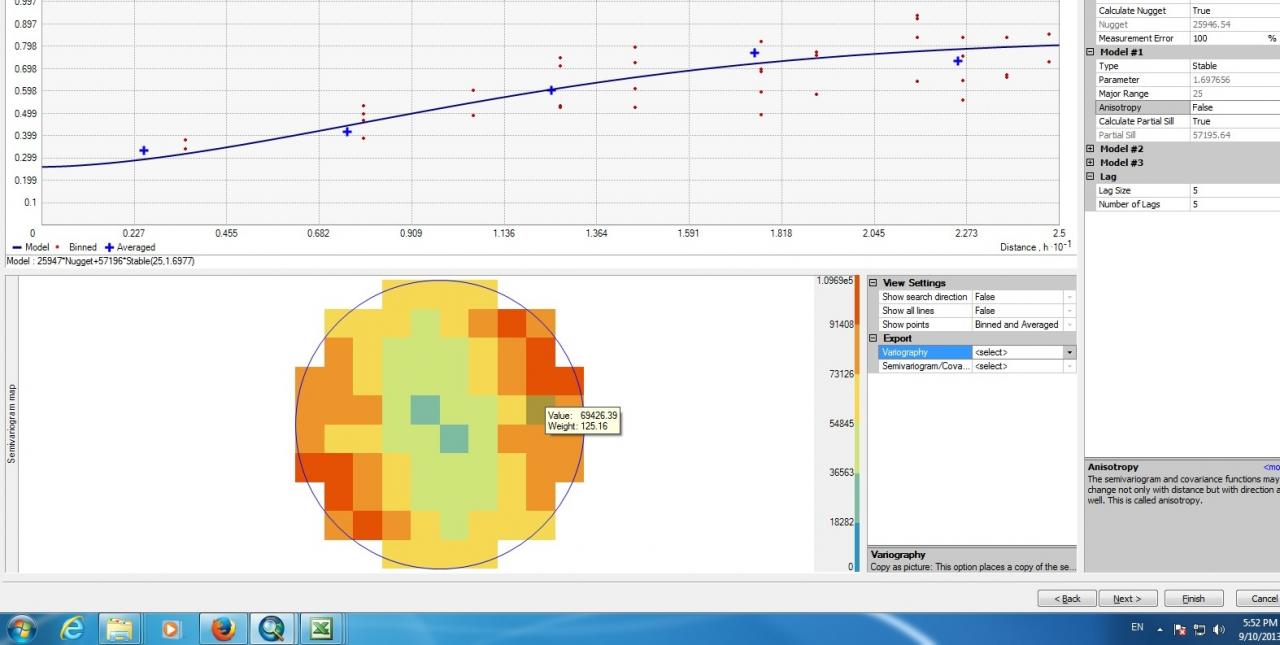
If you generate the Semivariogram using Geostatistical wizard. it will show you the Semivariogram map at the bottom of the window. (which looks like a raster map) (following image)
[ATTACH=CONFIG]27332[/ATTACH]
when you move the mouse pointer on the map, two numbers will pop up for each pixel
one is the Value of the cell and the other one is the Weight.
I understand that the "Value" should be the average of moment of inertia of the pairs in that specific bin
But I don't know what is the "Weight"? I could not find anything regarding to this number in the manual.
I would appreciate if someone could shed some light on this for me.
Regards
E
Solved! Go to Solution.
12 Replies
09-12-2013
01:35 PM
- Mark as New
- Bookmark
- Subscribe
- Mute
- Subscribe to RSS Feed
- Permalink
Looking at your graphic, it looks like you've decided to use quadrants 1 and 4. The shadow of the (1,1) bin may extend into the 2nd and 3rd quadrants. The shadow in the 2nd quadrant needs to be inflected into quadrant 4, and the shadow from quadrant 3 needs to be inflected to quadrant 1. These weights need to be added to the weights that are already in those quadrants.
Here's a quick test: make two points with the same coordinates so that their vector plots at the origin. The (1,1) and (1,-1) bins should each get a weight of 0.5 (they'll each get 0.25 naturally, then another 0.25 from the inflection).
If that doesn't work, I don't think I can help you. You've pretty much exhausted my knowledge of our binning mechanism.
09-12-2013
05:19 PM
- Mark as New
- Bookmark
- Subscribe
- Mute
- Subscribe to RSS Feed
- Permalink
Thanks a bunch Eric.
I have got most of the answers. and for that, I appreciate your time and kindness.
e
I have got most of the answers. and for that, I appreciate your time and kindness.
e
06-01-2014
10:47 PM
- Mark as New
- Bookmark
- Subscribe
- Mute
- Subscribe to RSS Feed
- Permalink
going through the whole thread, red dots come from rectangular bins and blue dots come from concentric circles.
wont averaging the red dots give the blue dots?
" for curve fitting the variogram which decides the range,sill and nugget, the blue dots come into play( related to concentric circles or radial bins) and not the red dots...and hence semvariogram map UI doesnt have anything to do this the final kriging map"
Is this statement right or wrong? please give me an answer
- « Previous
-
- 1
- 2
- Next »
- « Previous
-
- 1
- 2
- Next »