- Home
- :
- All Communities
- :
- Products
- :
- Geoprocessing
- :
- Geoprocessing Questions
- :
- Re: Tabulate Area 2 only including some cases
- Subscribe to RSS Feed
- Mark Topic as New
- Mark Topic as Read
- Float this Topic for Current User
- Bookmark
- Subscribe
- Mute
- Printer Friendly Page
Tabulate Area 2 only including some cases
- Mark as New
- Bookmark
- Subscribe
- Mute
- Subscribe to RSS Feed
- Permalink
Hoping someone can help me with this one, as I'm at a loss!
I'm using the Tabulate Area 2 tool (similar to Tabulate Area, except that it can handle overlapping polygons, of which there are many in my data). I have two shapefile feature classes (EW_buff3 and ES_buff2) that were made by buffering points in my map area. The "class" raster is a statewide land use raster. (In brief, I'm trying to tabulate the amount of each type of land use in each circle of EW_buff3 and ES_buff2).
Here's the issue: when I run the tool comparing either EW_buff3 or ES_buff2 to the lower peninsula land use raster, I only get 693 cases in the output table. (EW_buff3 contains 2007 cases, and ES_buff2 contains 3454, so it doesn't seem to be anything about those files that is resulting in the 693-case result.)
The geostatistical analysis environment is set to include all coincident points, so it doesn't seem to be flattening the overlapping points into a single layer.
I'd just carried out this same function successfully with two other shapefile feature classes (R1_buff and R2_buff) that were created in the same manner as EW_buff3 and ES_buff2, using the same land cover raster, so I know it's not a basic problem with my process (though I will note, that those two feature classes both contain fewer than 693 cases, so if there's something causing an upper limit to the number of cases processed, that issue wouldn't have shown up with them).
I've examined the Tabulate Area 2 output table to identify some of the missing cases (seeing with FID numbers aren't listed) and going back to the EW_buff3 and ES_buff2 tables, but there doesn't seem to be anything unique about those records not being tabulated.
I'm using ArcGIS 10.3.1 for Desktop.
What might I be missing?? I'll check any suggestions you think might be causing this! Thanks!
- Mark as New
- Bookmark
- Subscribe
- Mute
- Subscribe to RSS Feed
- Permalink
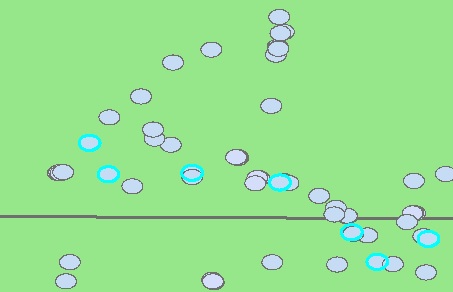
symbolize your buffers with no fill pattern and differing outline colors. Find an area that you think is incorrect, select the records in the table and have a look-see and/or do a screen grab ... sometimes combining the visual with the tabular does the trick. I suspet you have been staring at this too long.
- Mark as New
- Bookmark
- Subscribe
- Mute
- Subscribe to RSS Feed
- Permalink
There doesn't seem to be any pattern (that I can find, anyhow) as to which records are being tabulated, and which excluded. Here's a small area of the map with some of the records that did get tabulated, selected from the source layer (the ones unselected weren't necessarily included-- I only went through the first 100 or so records and selected just those that were in the Tab Area 2 output table. But I did think it was a good think to look for, in case, say, only those not overlapping other polygons were being included. That does not appear to be the case, though.)
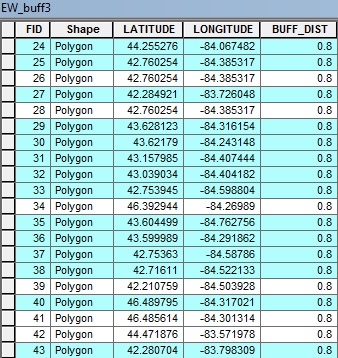
Here's also a snippet of part of the source layer table-- the selected cases are ones that were included in the Tabulate Area 2 output. I'm not seeing any commonality between those selected, or among those excluded.
Perhaps most puzzlingly, I'm getting the same number of records in the Tabulate Area 2 output table, even when running the tool with source layers with different #s of records. It's make a bit more sense to me if it was just giving fewer records in the output, but not the identical number both times-- I'd think there was something wrong with how I was selecting the data, the environment settings, etc. The fact that it's limited the output to the same number of cases, both times, leads me to speculate that it must be something in how the tool is functioning...?
- Mark as New
- Bookmark
- Subscribe
- Mute
- Subscribe to RSS Feed
- Permalink
New Spatial Analyst Supplemental tools, v1.3 | ArcGIS Blog
some related threads, the blog, and two issue ones. First, project your data so you can get area and measures in projected coorinates.
I am seeing duplicate coordinates... are they supposed to be ignored or included? (ie 25, 26, 28).
You did you produce a coincidence table to find the matches?
Next questions... why are there exact duplicates? are these observations at different points in time? or are they just do to multiple observations at the same time? I always get worried about duplicates...