- Home
- :
- All Communities
- :
- Products
- :
- Geoprocessing
- :
- Geoprocessing Questions
- :
- Re: Set Method in raster Classification in Model B...
- Subscribe to RSS Feed
- Mark Topic as New
- Mark Topic as Read
- Float this Topic for Current User
- Bookmark
- Subscribe
- Mute
- Printer Friendly Page
Set Method in raster Classification in Model Builder
- Mark as New
- Bookmark
- Subscribe
- Mute
- Subscribe to RSS Feed
- Permalink
I am using ArcGIS 10.3. Is there any method to set a constant Method (e.g. Standard Deviation) in a raster classification in the Model Builder with the use of the Reclassify tool or any other?
If I change the options manually the first time, it will change to another Method (Natural breaks usually) when I change the input raster.
Solved! Go to Solution.
Accepted Solutions
- Mark as New
- Bookmark
- Subscribe
- Mute
- Subscribe to RSS Feed
- Permalink
You could add the Get Raster Properties tool to our model to get the mean and standard deviation of your raster, naming those model elements raster mean and raster stdev. Once you've done that, use the Raster Calculator to extract your top zone using Con, and wrap that with the Zonal Centroid tool to get your centroid cell. The results (a grid that has one data cell at the zone's centroid) could then be passed to Raster To Point to get a point feature.
(I'm assuming you have access to Spatial Analyst since you were using the Reclassify tool.)
Isn't map algebra awesome?
ZonalGeometry(
Con("raster" > (%raster mean% + (2 * %raster stdev%)), 1),
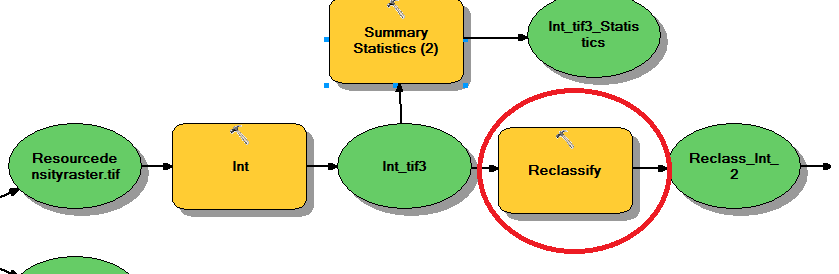
"VALUE", "CENTROID")Side note: I noticed that your model is piping your raster to the Summary Statistics tool to get some raster stats. Depending what you are calculating, the Get Raster Properties tool would be a better choice to get raster statistics, as the Summary Statistics tool calculates stats off the raster table, not the raster.
- Mark as New
- Bookmark
- Subscribe
- Mute
- Subscribe to RSS Feed
- Permalink
I am not seeing any... parameters in your model... why don't you set some so the user can provide inputs
- Mark as New
- Bookmark
- Subscribe
- Mute
- Subscribe to RSS Feed
- Permalink
Thank for your reply Dan. The only parameters I can set is the reclass field which in my case is constant ( the density of the resource ). What I want to do is to set only the method of classification as Standard Deviation (Data classification methods—ArcGIS Pro | ArcGIS Desktop), not even the values. So in the case I will change the density raster I will always have a classification by Standard Deviation for the new raster.
What is happening now is that I need to run the model one time, set the reclassification on standard deviation with the data saved in during the first run and then I can have my visualization. If I change the density raster, it will keep the values of the classification of the previous run and I have to change it manually again to Standard Deviation.
Maybe Reclassification is not the best way to do it, is there maybe any other method to set the method of classification in the model builder?
- Mark as New
- Bookmark
- Subscribe
- Mute
- Subscribe to RSS Feed
- Permalink
I don't use modelbuilder enough, but can you use a layer file for the symbology if that is all you want to do is look at it and not use the reclassification results
- Mark as New
- Bookmark
- Subscribe
- Mute
- Subscribe to RSS Feed
- Permalink
That is the problem. The model I am building is classifying the density of some resources, so I will have, for instance 5 classes, from "1", the lowest density density areas, to "5", the highest density areas. Then extracting the polygons of areas "5" and get the centroids, I will get the highest density point, to use for further researches. For being replicable for different resources I need the classification done with the same method (Standard Deviation). Is there any other method to get the centroids of the highest density areas, by-passing the classification of the resources?
- Mark as New
- Bookmark
- Subscribe
- Mute
- Subscribe to RSS Feed
- Permalink
You could add the Get Raster Properties tool to our model to get the mean and standard deviation of your raster, naming those model elements raster mean and raster stdev. Once you've done that, use the Raster Calculator to extract your top zone using Con, and wrap that with the Zonal Centroid tool to get your centroid cell. The results (a grid that has one data cell at the zone's centroid) could then be passed to Raster To Point to get a point feature.
(I'm assuming you have access to Spatial Analyst since you were using the Reclassify tool.)
Isn't map algebra awesome?
ZonalGeometry(
Con("raster" > (%raster mean% + (2 * %raster stdev%)), 1),
"VALUE", "CENTROID")Side note: I noticed that your model is piping your raster to the Summary Statistics tool to get some raster stats. Depending what you are calculating, the Get Raster Properties tool would be a better choice to get raster statistics, as the Summary Statistics tool calculates stats off the raster table, not the raster.
- Mark as New
- Bookmark
- Subscribe
- Mute
- Subscribe to RSS Feed
- Permalink
Thanks Curtis, that is exactly what I was looking for, I adapted what you suggested to my case. The suggestion to use Raster Calculator was key. I didn't find the Zonal Geometry tool inside the Raster Calculator, but I calculated the condition as you said and then I adapted the rest. Now it works nicely. See attached how it looks like now. Thank you.