- Home
- :
- All Communities
- :
- Products
- :
- Geoprocessing
- :
- Geoprocessing Questions
- :
- I need help with Geocoding Multiple Addresses
- Subscribe to RSS Feed
- Mark Topic as New
- Mark Topic as Read
- Float this Topic for Current User
- Bookmark
- Subscribe
- Mute
- Printer Friendly Page
I need help with Geocoding Multiple Addresses
- Mark as New
- Bookmark
- Subscribe
- Mute
- Subscribe to RSS Feed
- Permalink
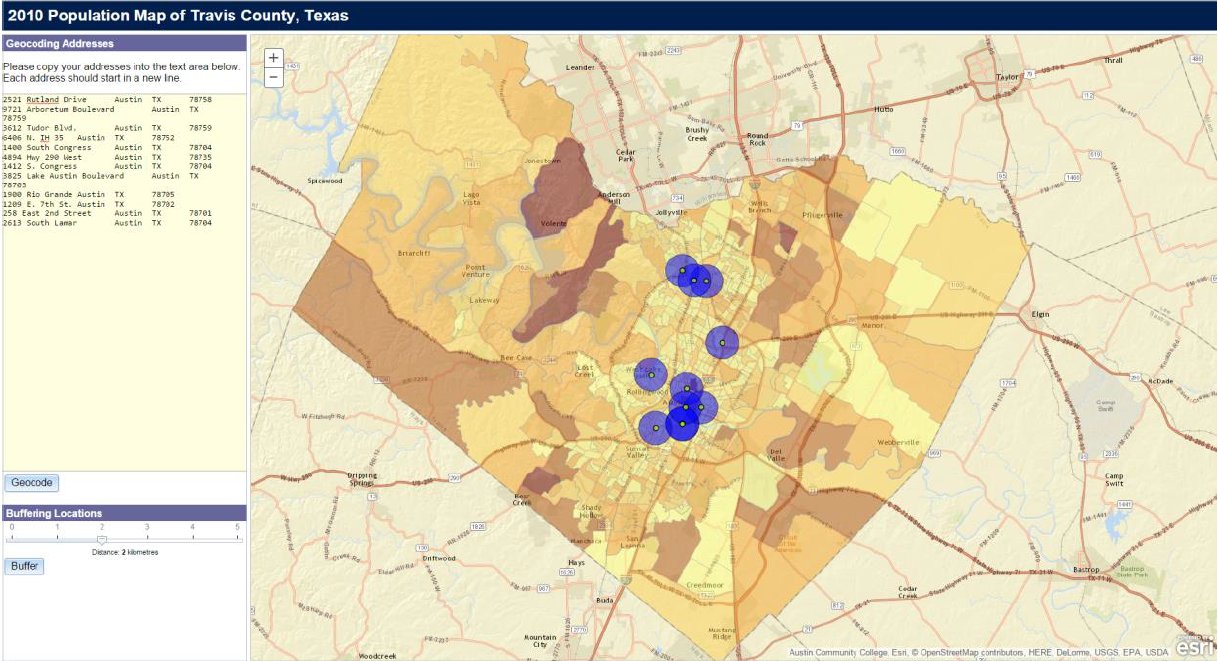
Ok so I have some working code with a geocode service in it already. Again you wont see what i have which is a map of Austin, Texas. I need to have a text area where i can place multiple addresses and then have them geocode ontop of the map when i click a button. I really just need help with this part for now. I will include two files one with the HTML code i need edited and one with HTML to be added to the other or at least somehow implemented. The result should look like this.
any help will be greatly appreciated
- Mark as New
- Bookmark
- Subscribe
- Mute
- Subscribe to RSS Feed
- Permalink
Sorry forgot to mention why you wont see the map. Its being done on a virtual machine, with arcgis server and adaptor. if you have either of these you might be able to see things.
- Mark as New
- Bookmark
- Subscribe
- Mute
- Subscribe to RSS Feed
- Permalink
another thing your candidate score will need to be >80
- Mark as New
- Bookmark
- Subscribe
- Mute
- Subscribe to RSS Feed
- Permalink
moved to Geoprocessing since Community Help is about getting help on the GeoNet community
- Mark as New
- Bookmark
- Subscribe
- Mute
- Subscribe to RSS Feed
- Permalink
Oh, ok thanks for the update. I knew i had posted in the wrong place
- Mark as New
- Bookmark
- Subscribe
- Mute
- Subscribe to RSS Feed
- Permalink
Can anyone help me. I am desperate?
- Mark as New
- Bookmark
- Subscribe
- Mute
- Subscribe to RSS Feed
- Permalink
I have a n update to my code:
<!DOCTYPE html>
<html>
<head>
<meta http-equiv="Content-Type" content="text/html; charset=utf-8">
<meta name="viewport" content="initial-scale=1, maximum-scale=1, user-scalable=no">
<title></title>
<link rel="stylesheet" href="https://js.arcgis.com/3.16/esri/css/esri.css">
<link rel="stylesheet" href="https://js.arcgis.com/3.16/dijit/themes/claro/claro.css">
<style>
html,body {
height:100%;
width:100%;
}
body {
overflow:hidden;
}
#title{
font-size: 25px;
font-weight: bold;
color: white;
}
#map{
padding: 0px;
}
.item{
width: 100%;
height: 25px;
padding:0;
background-color: #775500;
}
.itemText{
color: white;
padding:5px 0 0 5px;
margin:0;
vertical-align: bottom;
font-size: 12;
font-weight: bold;
}
#legendDiv
{
padding-left: 10px;
margin:0;
}
.instruction
{
padding:1;
margin-bottom:5px;
}
#layerList
{
padding-left:10px;
padding-top:10px;
}
<!--#search {
display: block;
position: absolute;
z-index: 3;
top: 25px;
left: 50px;
}-->
.spotlight {
z-index:-1;
position:absolute;
left:50%;
top:50%;
border-radius:50%;
opacity:0;
box-shadow:
inset rgba(0,0,0,0.25) 0px 0px 20px 20px,
rgba(0,0,0,0.50) 0px 0px 0px 1000px;
transition:all 1000ms;
-moz-transition:all 1000ms;
-webkit-transition:all 1000ms;
}
.spotlight-active {
z-index:2;
opacity:1;
}
</style>
<script src="https://js.arcgis.com/3.16/"></script>
<script>
var map, layerList;
require([
"esri/map",
"esri/dijit/Geocoder",
"esri/tasks/locator",
"esri/graphic",
"esri/symbols/SimpleMarkerSymbol",
"esri/geometry/screenUtils",
"dojo/dom",
"dojo/dom-construct",
"dojo/query",
"dojo/_base/Color",
"esri/layers/ArcGISDynamicMapServiceLayer",
"esri/dijit/LayerList",
"esri/layers/FeatureLayer",
"esri/InfoTemplate",
"esri/renderers/smartMapping",
"dojo/parser",
"dijit/form/Button",
"dijit/registry",
"dijit/layout/BorderContainer",
"dijit/layout/ContentPane",
"dijit/form/Select",
"dojo/domReady!"],
function(
Map,
Geocoder,
Locator,
Graphic,
SimpleMarkerSymbol,
screenUtils,
dom,
domConstruct,
query,
Color,
ArcGISDynamicMapServiceLayer,
LayerList,
FeatureLayer,
InfoTemplate,
smartMapping,
parser,
Button,
registry
){
parser.parse();
map = new Map("map", {
basemap: "streets",
center: [-97.6982,30.3097],
zoom: 11
});
map.infoWindow.resize(200,125);
var texasLayer = new FeatureLayer("http://localhost:6080/arcgis/rest/services/Austin_Texas/MapServer/0",{mode: FeatureLayer.MODE_SNAPSHOT, outFields:["*"], id:"capital", /*infoTemplate:infoTemplate*/});
texasLayer.setOpacity(.40);
map.addLayers([texasLayer]);
//url = "http://sampleserver1.arcgisonline.com/ArcGIS/rest/services/Locators/ESRI_Geocode_USA/GeocodeServer";
url="http://localhost:6080/arcgis/rest/services/Austin_Streets/GeocodeServer";
locator = new Locator (url);
registry.byId("search2").on("click", doGeocoding)
button.on("click", doGeocoding);
function doGeocoding(){
//Retrive the addresses from the text area
var textArea = dom.byId("search1");
var inputAddresses = textArea.value.replace(/\r\n/g, "\n").split("\n");
var addresses = [];
for (i=0;i<inputaddresses.length;i++){
var address = {"OBJECTID": i, "Single Line Input": inputaddresses};
addresses.push(address);
}
var params = {addresses: address};
locator.addressesToLocations(params, showResults);
}
function showResults(response) {
var candidate;
var symbol = new SimpleMarkerSymbol();
var infoTemplate = new InfoTemplate(
"Location",
"Address: ${city}<br />Score: ${score}"
);
symbol.setStyle(SimpleMarkerSymbol.STYLE_CIRCLE);
symbol.setColor(new Color([153,0,51,0.75]));
var geom; //The geometry of the geocoded point
arrayUtils.every(response, function(candidate) {
console.log(candidate.score);
if (candidate.score > 80){
var attributes = {
city: candidate.city,
score: candidate.score,
locatorName: candidate.attributes.Addr_type
};
geom = candidate.location;
var graphic = new Graphic(geom, symbol,attributes,infoTemplate);
map.graphics.add(graphic);
return false;
}
else
{
return true;
}
});
//Zoom to the geocoded point
if ( geom !== undefined ) {
map.centerAndZoom(geom, 12);
}
}
});
</script>
</head>
<body class="claro">
<div id="mainWindow" data-dojo-type="dijit/layout/BorderContainer" data-dojo-props="design:'headline', gutters:true" style="width:100%; height:100%; padding:0;">
<div id="header" data-dojo-type="dijit/layout/ContentPane" data-dojo-props="region:'top'" style="height:30px; background-color:#478;">
<div id="title">2010 Population Map of Travis County, Texas</div>
</div>
<div id="leftPane" data-dojo-type="dijit/layout/ContentPane" data-dojo-props="region:'left'" style="width:300px; padding:0; margin:0">
<div class="item"><p class="itemText">Geocoding addresses</p>
<textarea id="search1" rows="25" cols="35"></textarea>
<button id="search2" data-dojo-type="dijit/form/Button">Locate</button>
</div>
</div>
<div id="map" data-dojo-type="dijit/layout/ContentPane" data-dojo-props="region:'center'"></div>
</div>
</body>
</html>