- Home
- :
- All Communities
- :
- Products
- :
- Geoprocessing
- :
- Geoprocessing Questions
- :
- Re: How to find deviation of vehicle trajectory po...
- Subscribe to RSS Feed
- Mark Topic as New
- Mark Topic as Read
- Float this Topic for Current User
- Bookmark
- Subscribe
- Mute
- Printer Friendly Page
How to find deviation of vehicle trajectory points from median?
- Mark as New
- Bookmark
- Subscribe
- Mute
- Subscribe to RSS Feed
- Permalink
Hello,
I am working on a project where I need to find the deviation of the vehicle trajectory path from centre line of median of the road. I have a large number of coordinates collected using GPS for both the trajectory path and the centre line of median. Is there any tool or some other way to have the deviation values in meters in the form of a table?
Regards
Solved! Go to Solution.
Accepted Solutions
- Mark as New
- Bookmark
- Subscribe
- Mute
- Subscribe to RSS Feed
- Permalink
Alice.... long story... have a look at the data and I can explain in detail but
- fixed the data to get long/lat in the right order
- trimmed to the common extent
- projected to utm 46N wgs84
- got the x, y values in both tables
- converted the median points to a median polyline representing 1 'Feature'
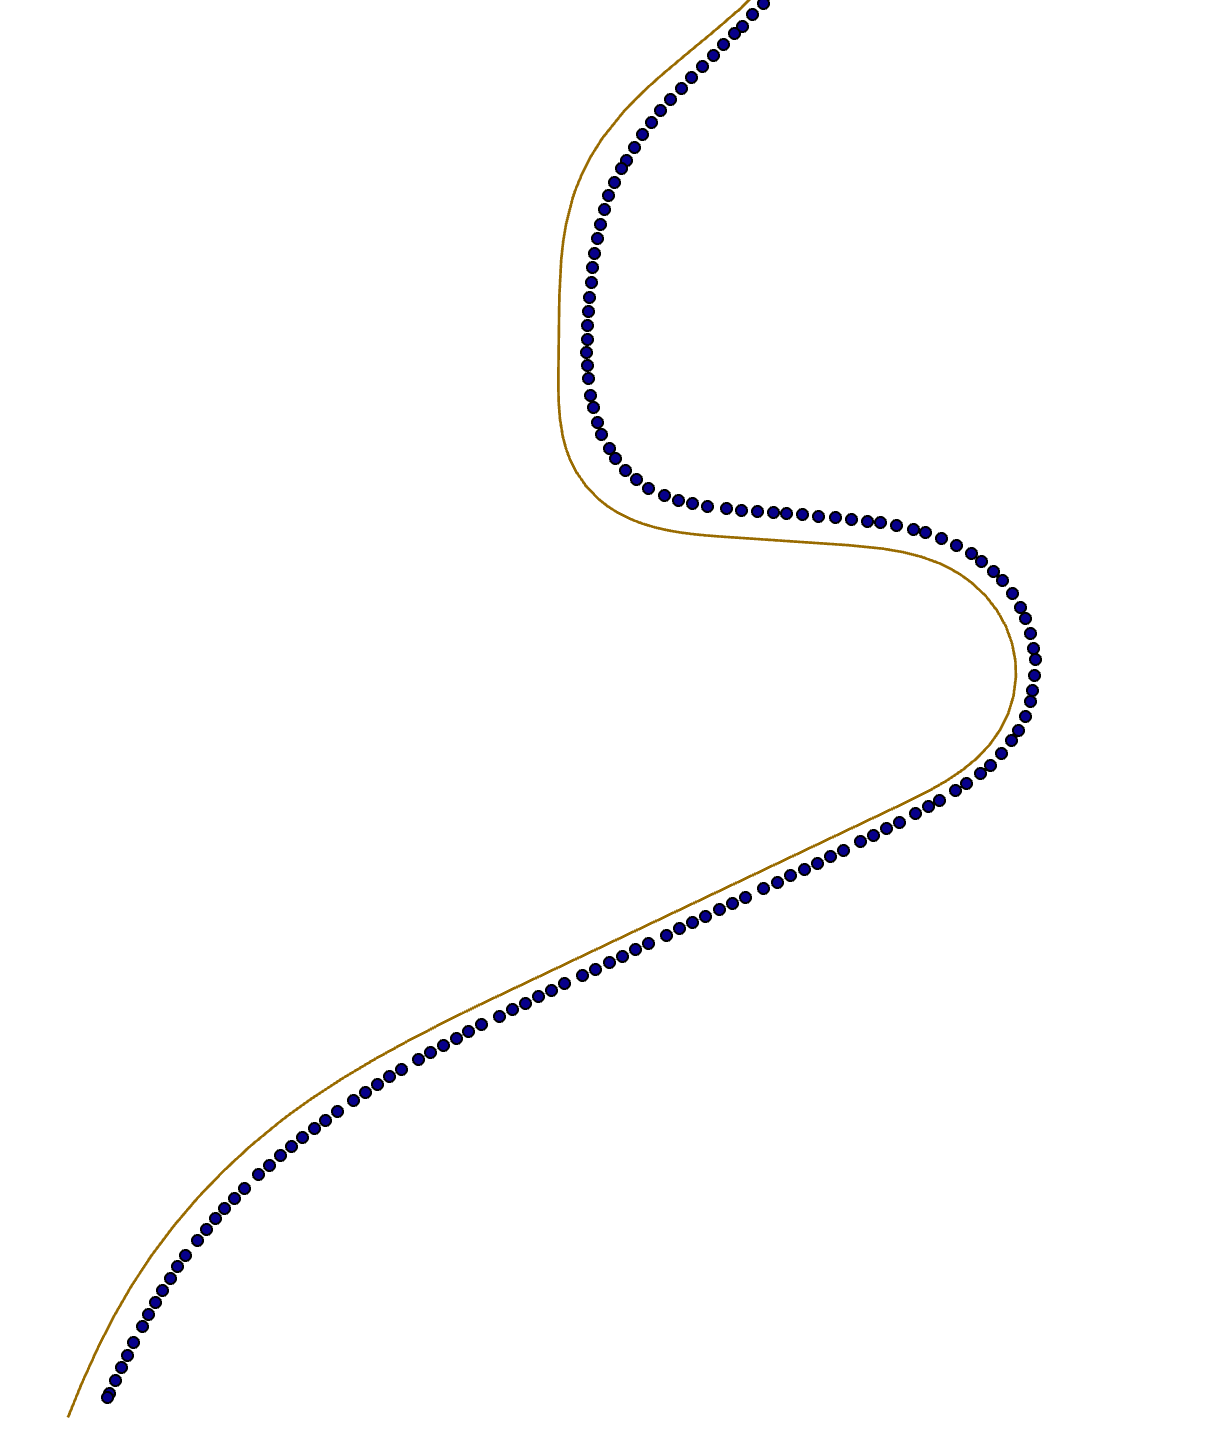
- used near on the vehicle data to get the near location distance and direction to the line
This is the southern end

The data are attached in an xls for your perusal
- Mark as New
- Bookmark
- Subscribe
- Mute
- Subscribe to RSS Feed
- Permalink
If you want a mean deviation in planar units, you will have to project all the coordinates to a suitable projection (eg. UTM). Once you have that in tabular form, you calculate the distance in another field using Pythagorean theorem. Those fields can then be use to obtain simple statistics using builtin tools.
I am not sure why you have ArcGIS Online as the chosen place. Perhaps you meant to post in Geoprocessing or ArcGIS Pro
If you were using ArcGIS PRO and not ArcGIS Online, then you could use
Table Tools.... or
Statistics ... Descriptive Statistics for multiple fields ...
- Mark as New
- Bookmark
- Subscribe
- Mute
- Subscribe to RSS Feed
- Permalink
Thankyou so much. I wasn't sure which place would be apt to put up the query. I am using ArcMap and quite new to this. Can the median be converted to a smooth curve and shortest distance from each point of the vehicle trajectory be calculated from the curve? I have tried using the near tool for this but it takes only point values.
- Mark as New
- Bookmark
- Subscribe
- Mute
- Subscribe to RSS Feed
- Permalink
The last time I worked on this stuff we converted the centerline to points to facilitate the equivalent of today's Near tool.
If the centerline is fairly detailed representing the true shape (particular in the area of circular curves) then you won't have much problem.
Once the gps are associated with a near position, fine-tuning can begin.
Perhaps if you have a sample of the road segment and its gps denoted vehicle trajectory data, it would help. A picture for now and/or a small sample in a geodatabase
would be interesting.
- Mark as New
- Bookmark
- Subscribe
- Mute
- Subscribe to RSS Feed
- Permalink
I have attached a .xlsx file along with my question. Kindly see if it helps.
- Mark as New
- Bookmark
- Subscribe
- Mute
- Subscribe to RSS Feed
- Permalink
Alice... working on it. What projected coordinate system do you use for your area?
I assume current values represent GCS WGS84 and longitudes and latitudes are both positive as shown.
There is also incomplete overlap between the two sets which I presume is correct
- Mark as New
- Bookmark
- Subscribe
- Mute
- Subscribe to RSS Feed
- Permalink
Projected coordinate system is WGS84 46N. Yup, lat and long values are positive.
- Mark as New
- Bookmark
- Subscribe
- Mute
- Subscribe to RSS Feed
- Permalink
Your X and Y's are switched ie Y_rd_median isn't the Y values which should be longitude. Longitude is X
That slowed me. I have stuff projected now and will try to dissect the overlapping area.
I suggest you do the same so you have the common extent of both since they don't overlap directly in the north/south direction
- Mark as New
- Bookmark
- Subscribe
- Mute
- Subscribe to RSS Feed
- Permalink
Alice.... long story... have a look at the data and I can explain in detail but
- fixed the data to get long/lat in the right order
- trimmed to the common extent
- projected to utm 46N wgs84
- got the x, y values in both tables
- converted the median points to a median polyline representing 1 'Feature'
- used near on the vehicle data to get the near location distance and direction to the line
This is the southern end

The data are attached in an xls for your perusal
- Mark as New
- Bookmark
- Subscribe
- Mute
- Subscribe to RSS Feed
- Permalink
Thank you so much for the help! Exactly what I needed.