- Home
- :
- All Communities
- :
- Products
- :
- Geoprocessing
- :
- Geoprocessing Questions
- :
- Extract Multi Values to Points and Mosaic Dataset
- Subscribe to RSS Feed
- Mark Topic as New
- Mark Topic as Read
- Float this Topic for Current User
- Bookmark
- Subscribe
- Mute
- Printer Friendly Page
Extract Multi Values to Points and Mosaic Dataset
- Mark as New
- Bookmark
- Subscribe
- Mute
- Subscribe to RSS Feed
- Permalink
Hi everyone,
I have a question about geoprocessing tools and Mosaic Dataset. Can the Extract Multi Values to Points tool (or the like e.g., Sample etc.) be used to extract pixel values from a Mosaic Dataset comprised of individual raster images in a stack (monthly climate values) and across non-overlapping tiles (for example, 1x1 degree tiles)?
I’ve tried several different extraction tools but not matter what I do, the same cell value gets extracted for each point location. Further, the value that gets extracted is not contained in any of the raster images. My only suspicion for this later issue is that it’s calculating a summary statistic i.e., mean of the monthly values for the pixels that are coincident with the X, Y coordinate location.
I’m fairly new to using Mosaic Datasets so perhaps it’s merely operator error however; I would expect this to be a standard operation as I have already been performing this using points and individual images with this tool.
Thanks,
Chuck
- Mark as New
- Bookmark
- Subscribe
- Mute
- Subscribe to RSS Feed
- Permalink
Hi Xander,
I see how this can work but, I'm having trouble setting it up. Could you please show the steps used to "The first band contains the DTM and the second the DSM. If I add the mosaic twice to my data frame and visualize one using a raster function that extracts the first band, and the second extracting the second band:"
Just to be clear on my raster images here's what I have:
Tile "X1" (12 individual images-1 image per month)
Tile "X2" (12 individual images-1 image per month)
Tile "X3" (12 individual images-1 image per month)
The monthly images within each "X" tile have the exact same extent (a time series).
Thanks,
Chuck
- Mark as New
- Bookmark
- Subscribe
- Mute
- Subscribe to RSS Feed
- Permalink
Chuck... I am just curious, what is it you are trying to do with the data? Just view it or do you intend to do some analysis/summary with it?
The only reason I ask, is when I see 'multi-anything' and it isn't some spectral band reference to remote sensing and imagery, I wonder what people are doing with their data. I also wonder if people know about the other tools available to work with multidimensional raster/array data that contains interval/ratio scale data. This question also surfaces when I see people extracting values to points, I wonder what the purpose of the extra step is from an analytical point of view. In other words, why are they extracting to points, if they intend to 'do something' with the points and if so, what is it they are using the point data structure for.
- Mark as New
- Bookmark
- Subscribe
- Mute
- Subscribe to RSS Feed
- Permalink
Hi Dan,
This is in fact an RS driven study. I am building tree species distribution models in an ensemble classifier using a substantial amount predictor data e.g., Landsat imagery (raw, indices, transformations in a time series), topographic derivatives, climate data, soils data, etc. and, reference data (plot data). Extracting the values from the predictor data for all of the reference data is just the first step in the study. Since I have so many climate image tiles, utilizing mosaic datasets seems to be the most efficient way to manage and build the preliminary datasets for analysis.
I will look into converting the rasters to NetCDF format and determine if that could be useful in the analysis.
Thanks for the tip,
Chuck
- Mark as New
- Bookmark
- Subscribe
- Mute
- Subscribe to RSS Feed
- Permalink
Ok... thanks... don't forget the numpy and scipy stacks as well and they only need numpy arrays (*.npy for single or *.npz for stacked) and may be a simpler data structure if most the array contents aren't temporal.
- Mark as New
- Bookmark
- Subscribe
- Mute
- Subscribe to RSS Feed
- Permalink
Hi Chuck Werstak ,
What I would probably do (if I didn't have a mosaic dataset) would be to create a band for each month and that would result in a mosaic with 12 bands. So for each tile you would use the composite bands tool to create a raster with 12 bands and load these rasters in a mosaic dataset that you configured to have 12 bands of the proper cell type.
Now that you have a mosaic dataset, you could have (or create) an additional field in the Footprints with the value of the month. This can be used in the query definition to filter a specific month. That should work too.
Edit: I have created mosaic dataset with multi-temporal data, and specified for each raster in an additional field in the footprints featureclass, the start and end date of the raster. This enables the visualization through time of the data when you time-enable the layer.
- Mark as New
- Bookmark
- Subscribe
- Mute
- Subscribe to RSS Feed
- Permalink
Hi Xander,
I think I was able to replicate what you did. The difference between the images you ginned up and mine are that you seem to have created an image stack from two different coincident images (tiles) whereas mine are separate images.
Would there be a way do the same thing less creating the image stack? That would help tremendously!
Thanks,
Chuck
- Mark as New
- Bookmark
- Subscribe
- Mute
- Subscribe to RSS Feed
- Permalink
Is it possible to share the content of the Footprints (a screenshot)?
For instance in the sample below:
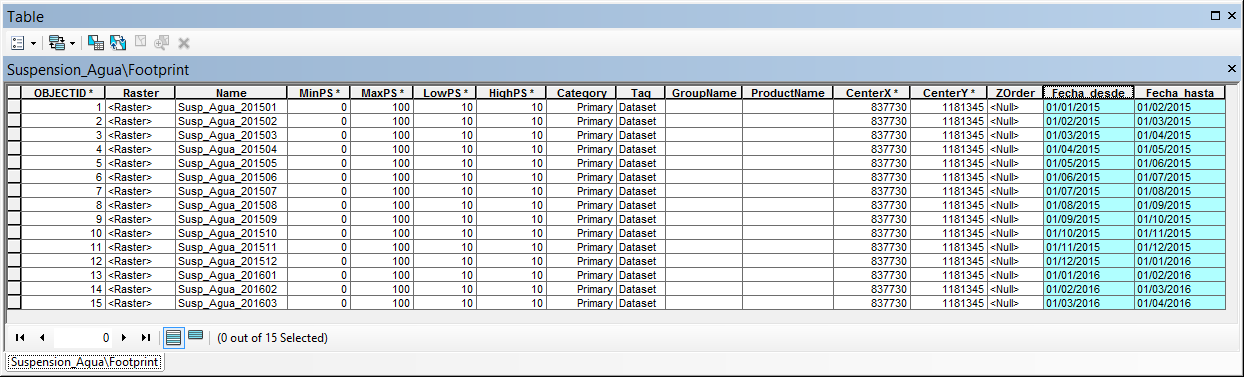
... each raster represents a date. The mosaic only contains a single band and each raster contains the same extent. I added two additional fields contains start- and end date for each raster.
- Mark as New
- Bookmark
- Subscribe
- Mute
- Subscribe to RSS Feed
- Permalink
Hi Xander,
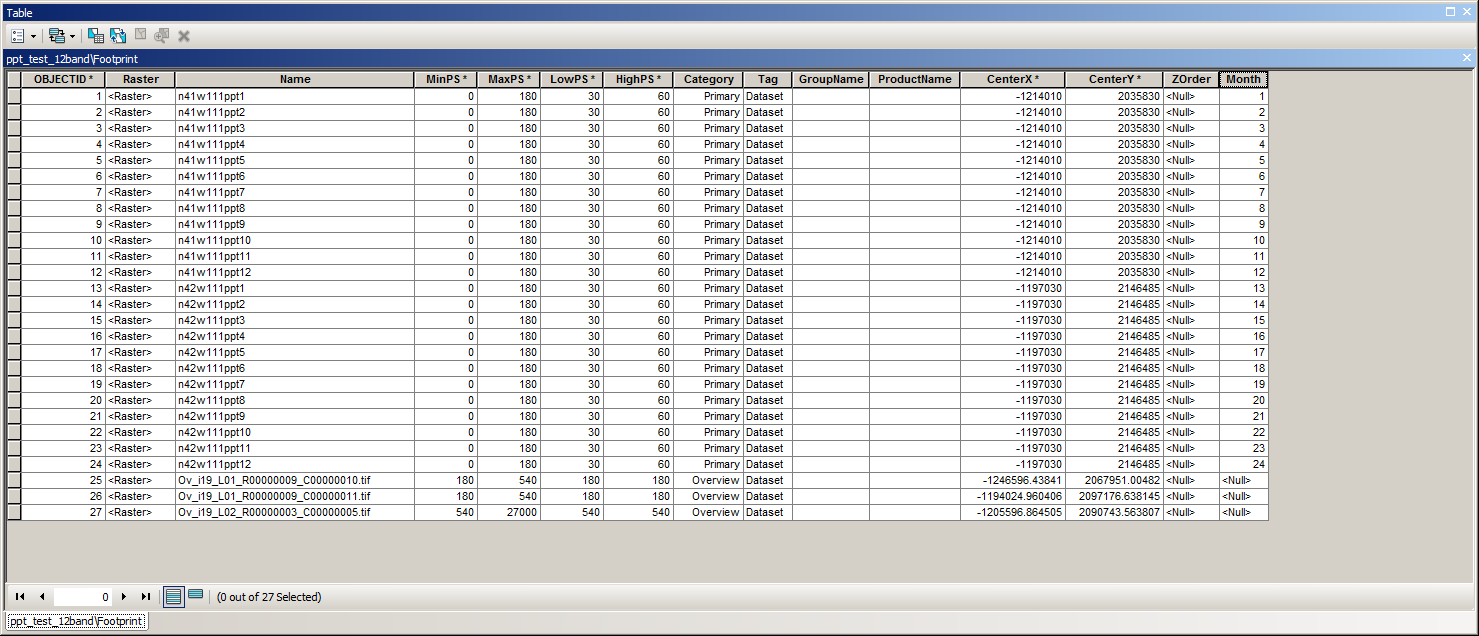
Here's the screen grab of the mosaic dataset attribute table.
I still can't seem to get this to work with individual image files loaded into the mosaic dataset. I can get it to work if I layer stack the images into one multi-band image.
Thanks,
Chuck
- Mark as New
- Bookmark
- Subscribe
- Mute
- Subscribe to RSS Feed
- Permalink
I assume that this is a screenshot of a test mosaic with 4 rasters:
n42w111ppt1
n42w111ppt2
n42w111ppt3
n42w111ppt4
... and 3 overviews. I see you created a field with the value of the month.
Could you provide a screenshot of the one that you created with all the rasters multiple tiles and all 12 months?
- Mark as New
- Bookmark
- Subscribe
- Mute
- Subscribe to RSS Feed
- Permalink
Xander,
Here's an example with 24 rasters in a mosaic dataset. I will eventually have thousands...