- Home
- :
- All Communities
- :
- Products
- :
- Geoprocessing
- :
- Geoprocessing Questions
- :
- Re: Cutting topographic data below a polyline
- Subscribe to RSS Feed
- Mark Topic as New
- Mark Topic as Read
- Float this Topic for Current User
- Bookmark
- Subscribe
- Mute
- Printer Friendly Page
Cutting topographic data below a polyline
- Mark as New
- Bookmark
- Subscribe
- Mute
- Subscribe to RSS Feed
- Permalink
Context: I want to cut *.xyz data for a river channel below the free surface.
I assume I want to use ArcGIS to generate a polyline based on my free surface data, and to clip out all topographic data that exceeds it. However, this isn't a method I've used before and it's been a long time since I've used ArcGIS. I've not found a method online either. Does anyone know where I could start, or what tools would be applicable?
Thanks in advance!
- Mark as New
- Bookmark
- Subscribe
- Mute
- Subscribe to RSS Feed
- Permalink
do you mean you want to retrieve only those areas where the elevation is above some threshold? or do you want to clip out the area that meets the same condition? Con and Clip would be two options. You can narrow other options down if you have more information.
- Mark as New
- Bookmark
- Subscribe
- Mute
- Subscribe to RSS Feed
- Permalink
Thanks for the reply!
Further detail:
I have channel topography in *.xyz data. My free surface data has no co-ordinate system attached, however - it's simply a data-plot of surface elevation. I need to use the surface data to create a threshold and then remove any topographic data above (ideally, remove anything above 0.1m below the threshold.) So I imagine I need to convert the data into something digestible by ArcGIS that will spatially match my topography, then use it to remove topographic data.
I'm not familiar Con. I will investigate further.
- Mark as New
- Bookmark
- Subscribe
- Mute
- Subscribe to RSS Feed
- Permalink
You have a DEM don't you? a visual woul help. and a sample of the x, y data would help. Right now, I am seeing a graph from which you need to determine a plane to intersect with the dem to slice off values not meeting the threshol
- Mark as New
- Bookmark
- Subscribe
- Mute
- Subscribe to RSS Feed
- Permalink
If I understand you correctly, the *.xyz data is an external text file. You need to make this into a raster file, then you can segment it at any elevation using con or the raster calculator or using reclassify.
- Mark as New
- Bookmark
- Subscribe
- Mute
- Subscribe to RSS Feed
- Permalink
Thanks for the help.
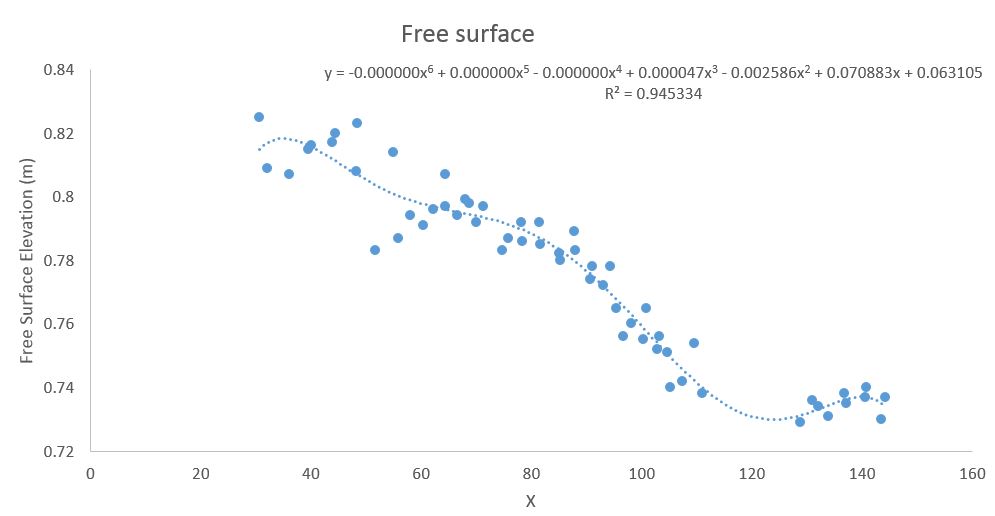
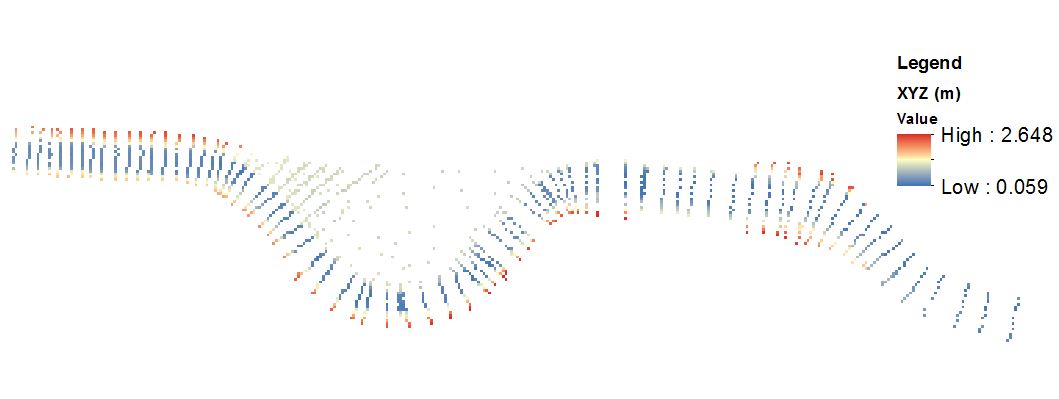
I have a raster of the data. My question mostly revolves around using the threshold: is it possible to use a polynomial as the threshold? The free surface varies on a slope.
I've attached images of my data - both the channel topography raster, and the graph of the raw free surface data (the threshold.) The channel topography needs to be below the free surface data.
I'm wondering, perhaps it would be easier to convert the channel away from cartesian to another system. I.e. "straighten" the channel along its centre-line before removing the data.
- Mark as New
- Bookmark
- Subscribe
- Mute
- Subscribe to RSS Feed
- Permalink
Hmmm, segmenting the raster or any spatial data relative to the stream line Z is a bit tricky.
Been thinking about a "relative dem" tool on my quiet moments for a while now.
But,yes, your approach could work.
- Mark as New
- Bookmark
- Subscribe
- Mute
- Subscribe to RSS Feed
- Permalink
Just wondering... The graph you present does not really have x and y values, but the "x" value should be the distance along the channel and the "y" value represents the Z value in the .xyz files. Is this true?.
I assume you converted the xyz file into a raster. However, to do this kind of operation would be easier in vector format (including on the original xyz file). Does the xyz file has any other information like distance along the channel center?
What you could do is to determine for each point (in case this information is not present) the position along the channel. Next use that distance and the formula you showed to calculate if it is below the free surface and only process those that are above the free surface.
There is a catch, though. When you look at the points on a "line" that has the same distance along the channel, the variation in Z is rather high since the borders of the channel are most likely included. Those will probably be evaluated using a different formula, or do you want to isolate those particular points? Did you use all these points to determine the free surface formula or did that came from another source?
- Mark as New
- Bookmark
- Subscribe
- Mute
- Subscribe to RSS Feed
- Permalink
Thanks for the response, Xander.
Re: the free surface graph, you're correct - the x value represents distance along the channel whilst y is free surface elevation on z. For the free surface data, the information constitutes the free surface elevation, as well as distance along the channel on x, y. The data is estimated fro measured discharge, depth, as well as width.
The data only has x in Cartesian form, so has information on distance along x but not directly related to the central channel line. Hence, I was thinking of converting the topography to channel-orientated co-ordinates (n,s) to make it easier to position each point.
For determining the position of each point, would it be as simple as creating a layer for placing particular points along the channel using their x,y? When you say process what Arc tools are you thinking of, given that there seems to be a few available.
You're also correct about the banks - the FS points are derived from near-bank locations, as such the channel borders are included. All these points were used to produce the free surface.
- Mark as New
- Bookmark
- Subscribe
- Mute
- Subscribe to RSS Feed
- Permalink
What I was thinking, is using the center of the channel (a line) to snap the points to a position on that line and get the distance to the center line. I consider that it would be best to model each class of distance to the center line (perhaps both side separately) since they will yield a different result.
Once you have the formulas it will not be very hard to select those points above the free surface. I would suggest using python to process the data. If you need some help and are willing to share the xyz file and the center line of the channel, I can have look what we can do.