- Home
- :
- All Communities
- :
- Products
- :
- Geoprocessing
- :
- Geoprocessing Questions
- :
- Re: Creating Polylines to track migration
- Subscribe to RSS Feed
- Mark Topic as New
- Mark Topic as Read
- Float this Topic for Current User
- Bookmark
- Subscribe
- Mute
- Printer Friendly Page
- Mark as New
- Bookmark
- Subscribe
- Mute
- Subscribe to RSS Feed
- Permalink
Hello!
I am a beginner in GIS and would like to create a representation of migration across borders. Can anyone recommend a "how to" resource?
I would like to show the movement from provinces, districts and/or towns.
Solved! Go to Solution.
Accepted Solutions
- Mark as New
- Bookmark
- Subscribe
- Mute
- Subscribe to RSS Feed
- Permalink
In case you don't want to have straight lines you could do something like this (black lines are the curves created in the script):
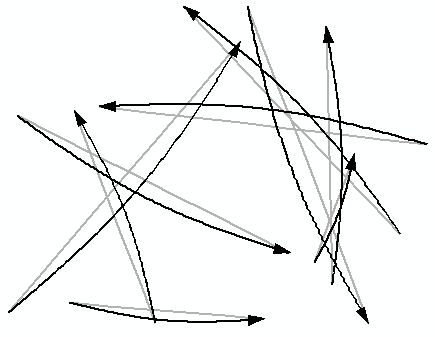
... using a little of Python code (ugly, I know, but will clean it up and convert it into a toolbox later...)
import arcpy
import math

def main():
    tbl = r"D:\Xander\GeoNet\MigrationRoutes\gdb\test.gdb\test_tbl"
    fc_out = r"D:\Xander\GeoNet\MigrationRoutes\gdb\test.gdb\migration06"
    sr = arcpy.SpatialReference(28992)

    flds = ("X1", "Y1", "X2", "Y2")
    curvature = 0.05 # 5%
    pnts_on_curve = 100

    lst_lines = []
    with arcpy.da.SearchCursor(tbl, flds) as curs:
        for row in curs:
            pnt1 = arcpy.Point(row[0], row[1])
            pnt2 = arcpy.Point(row[2], row[3])
            line = arcpy.Polyline(arcpy.Array([pnt1, pnt2]), sr)
            length = line.length
            offset = curvature * length
            delta_x = row[2] - row[0]
            delta_y = row[3] - row[1]

            # extract points on line
            arr = arcpy.Array()
            for i in range(0, pnts_on_curve + 1):
                frac = i / float(pnts_on_curve)
                pnt = line.positionAlongLine(frac, use_percentage=True)
                line_perp = perpendicular_line(line.firstPoint, line.lastPoint, pnt.firstPoint)
                asin = math.sin(frac * math.pi)
                dist_off = offset * asin
                pnt_new = line_perp.positionAlongLine(dist_off, use_percentage=False)
                arr.add(pnt_new.firstPoint)
            line_new = arcpy.Polyline(arr, sr)
            lst_lines.append(line_new)

    arcpy.CopyFeatures_management(lst_lines, fc_out)


class Coord(object):
    def __init__(self,x,y):
        self.x = x
        self.y = y

    def __sub__(self,other):
        # This allows you to substract vectors
        return Coord(self.x-other.x,self.y-other.y)

    def __repr__(self):
        # Used to get human readable coordinates when printing
        return "Coord(%f,%f)"%(self.x,self.y)

    def length(self):
        # Returns the length of the vector
        return math.sqrt(self.x**2 + self.y**2)

    def angle(self):
        # Returns the vector's angle
        return math.atan2(self.y,self.x)

def normalize(coord):
    return Coord(
        coord.x/coord.length(),
        coord.y/coord.length()
        )

def perpendicular(coord):
    return Coord(
        coord.length()*math.cos(coord.angle()+math.pi/2),
        coord.length()*math.sin(coord.angle()+math.pi/2)
        )

def perpendicular_line(coord_from, coord_to, coord_at):
    length = math.hypot(coord_from.X - coord_to.X, coord_from.Y - coord_to.Y)
    a = Coord(coord_from.X, coord_from.Y)
    b = Coord(coord_to.X, coord_to.Y)
    perp = perpendicular(normalize(a-b))
    perp_len = Coord(perp.x*length, perp.y*length)
    coord_perp = Coord(perp_len.x+coord_at.X, perp_len.y+coord_at.Y)
    return arcpy.Polyline(arcpy.Array([coord_at,
                                      arcpy.Point(coord_perp.x, coord_perp.y)]))


if __name__ == '__main__':
    main()
- Mark as New
- Bookmark
- Subscribe
- Mute
- Subscribe to RSS Feed
- Permalink
If you have a table with the X,Y (or lat, lon) of the from and to locations on a single record you can use the XY To Line (Data Management) tool. This will create straight lines between the from and to locations. The bad thing about this is that if you have migration between two locations in both directions, it will overlap.
- Mark as New
- Bookmark
- Subscribe
- Mute
- Subscribe to RSS Feed
- Permalink
In case you don't want to have straight lines you could do something like this (black lines are the curves created in the script):
... using a little of Python code (ugly, I know, but will clean it up and convert it into a toolbox later...)
import arcpy
import math

def main():
    tbl = r"D:\Xander\GeoNet\MigrationRoutes\gdb\test.gdb\test_tbl"
    fc_out = r"D:\Xander\GeoNet\MigrationRoutes\gdb\test.gdb\migration06"
    sr = arcpy.SpatialReference(28992)

    flds = ("X1", "Y1", "X2", "Y2")
    curvature = 0.05 # 5%
    pnts_on_curve = 100

    lst_lines = []
    with arcpy.da.SearchCursor(tbl, flds) as curs:
        for row in curs:
            pnt1 = arcpy.Point(row[0], row[1])
            pnt2 = arcpy.Point(row[2], row[3])
            line = arcpy.Polyline(arcpy.Array([pnt1, pnt2]), sr)
            length = line.length
            offset = curvature * length
            delta_x = row[2] - row[0]
            delta_y = row[3] - row[1]

            # extract points on line
            arr = arcpy.Array()
            for i in range(0, pnts_on_curve + 1):
                frac = i / float(pnts_on_curve)
                pnt = line.positionAlongLine(frac, use_percentage=True)
                line_perp = perpendicular_line(line.firstPoint, line.lastPoint, pnt.firstPoint)
                asin = math.sin(frac * math.pi)
                dist_off = offset * asin
                pnt_new = line_perp.positionAlongLine(dist_off, use_percentage=False)
                arr.add(pnt_new.firstPoint)
            line_new = arcpy.Polyline(arr, sr)
            lst_lines.append(line_new)

    arcpy.CopyFeatures_management(lst_lines, fc_out)


class Coord(object):
    def __init__(self,x,y):
        self.x = x
        self.y = y

    def __sub__(self,other):
        # This allows you to substract vectors
        return Coord(self.x-other.x,self.y-other.y)

    def __repr__(self):
        # Used to get human readable coordinates when printing
        return "Coord(%f,%f)"%(self.x,self.y)

    def length(self):
        # Returns the length of the vector
        return math.sqrt(self.x**2 + self.y**2)

    def angle(self):
        # Returns the vector's angle
        return math.atan2(self.y,self.x)

def normalize(coord):
    return Coord(
        coord.x/coord.length(),
        coord.y/coord.length()
        )

def perpendicular(coord):
    return Coord(
        coord.length()*math.cos(coord.angle()+math.pi/2),
        coord.length()*math.sin(coord.angle()+math.pi/2)
        )

def perpendicular_line(coord_from, coord_to, coord_at):
    length = math.hypot(coord_from.X - coord_to.X, coord_from.Y - coord_to.Y)
    a = Coord(coord_from.X, coord_from.Y)
    b = Coord(coord_to.X, coord_to.Y)
    perp = perpendicular(normalize(a-b))
    perp_len = Coord(perp.x*length, perp.y*length)
    coord_perp = Coord(perp_len.x+coord_at.X, perp_len.y+coord_at.Y)
    return arcpy.Polyline(arcpy.Array([coord_at,
                                      arcpy.Point(coord_perp.x, coord_perp.y)]))


if __name__ == '__main__':
    main()
- Mark as New
- Bookmark
- Subscribe
- Mute
- Subscribe to RSS Feed
- Permalink
Thank you for the tool. This looks like what I need. I will give it a try and let you know.
- Mark as New
- Bookmark
- Subscribe
- Mute
- Subscribe to RSS Feed
- Permalink
Thank you for this information. I will make x,y tables and see if I can get this to work. I am using arcmap 10.1, and I have not used Python yet. Now I will take a class in how to apply it.
-Rich
Sent from Windows Mail