- Home
- :
- All Communities
- :
- Services
- :
- Esri Training
- :
- Esri Training Questions
- :
- Re: May 15, 2018: Cartography. MOOC Ask Me Anythin...
- Subscribe to RSS Feed
- Mark Topic as New
- Mark Topic as Read
- Float this Topic for Current User
- Bookmark
- Subscribe
- Mute
- Printer Friendly Page
May 15, 2018: Cartography. MOOC Ask Me Anything (AMA)
- Mark as New
- Bookmark
- Subscribe
- Mute
- Subscribe to RSS Feed
- Permalink
Live Today! AMA Event on GeoNet
Tuesday, May 15, 9:30 a.m. - 10:30 a.m. (PDT)
Join our Cartography. MOOC guests here on the GeoNet Community for a LIVE AMA (Ask Me Anything) event. The AMA will take place in this discussion thread on Tuesday, May 15, 2018, from 9:30 a.m. - 10:30 a.m. (PDT).
*Click HERE to convert exact time for different countries.
This is an opportunity to ask our guests questions about the Cartography. MOOC course, about cartography in general, great maps, best practices or anything else that comes to mind.
AMA Guests
How does the AMA work? During the AMA, you can post your questions by clicking the "Add Reply" button below and our guests will reply to your questions in comments. You are welcome to post questions ahead of the AMA and they will answer them during the AMA.Please note: You must be logged in to post questions and see responses. See instructions on How to Log into GeoNet for the AMA. AMA Tips and GeoNet Community Guidelines
- When asking questions and comments during the AMA, remember to follow the GeoNet Community Guiding Principles: Be Helpful, Be Human, Be Smart.
- This discussion page will not auto-refresh, so please remember to refresh this page to see new questions, comments and replies.
Please note: The AMA will be live when you see a picture of our guests below. We are live!
 | 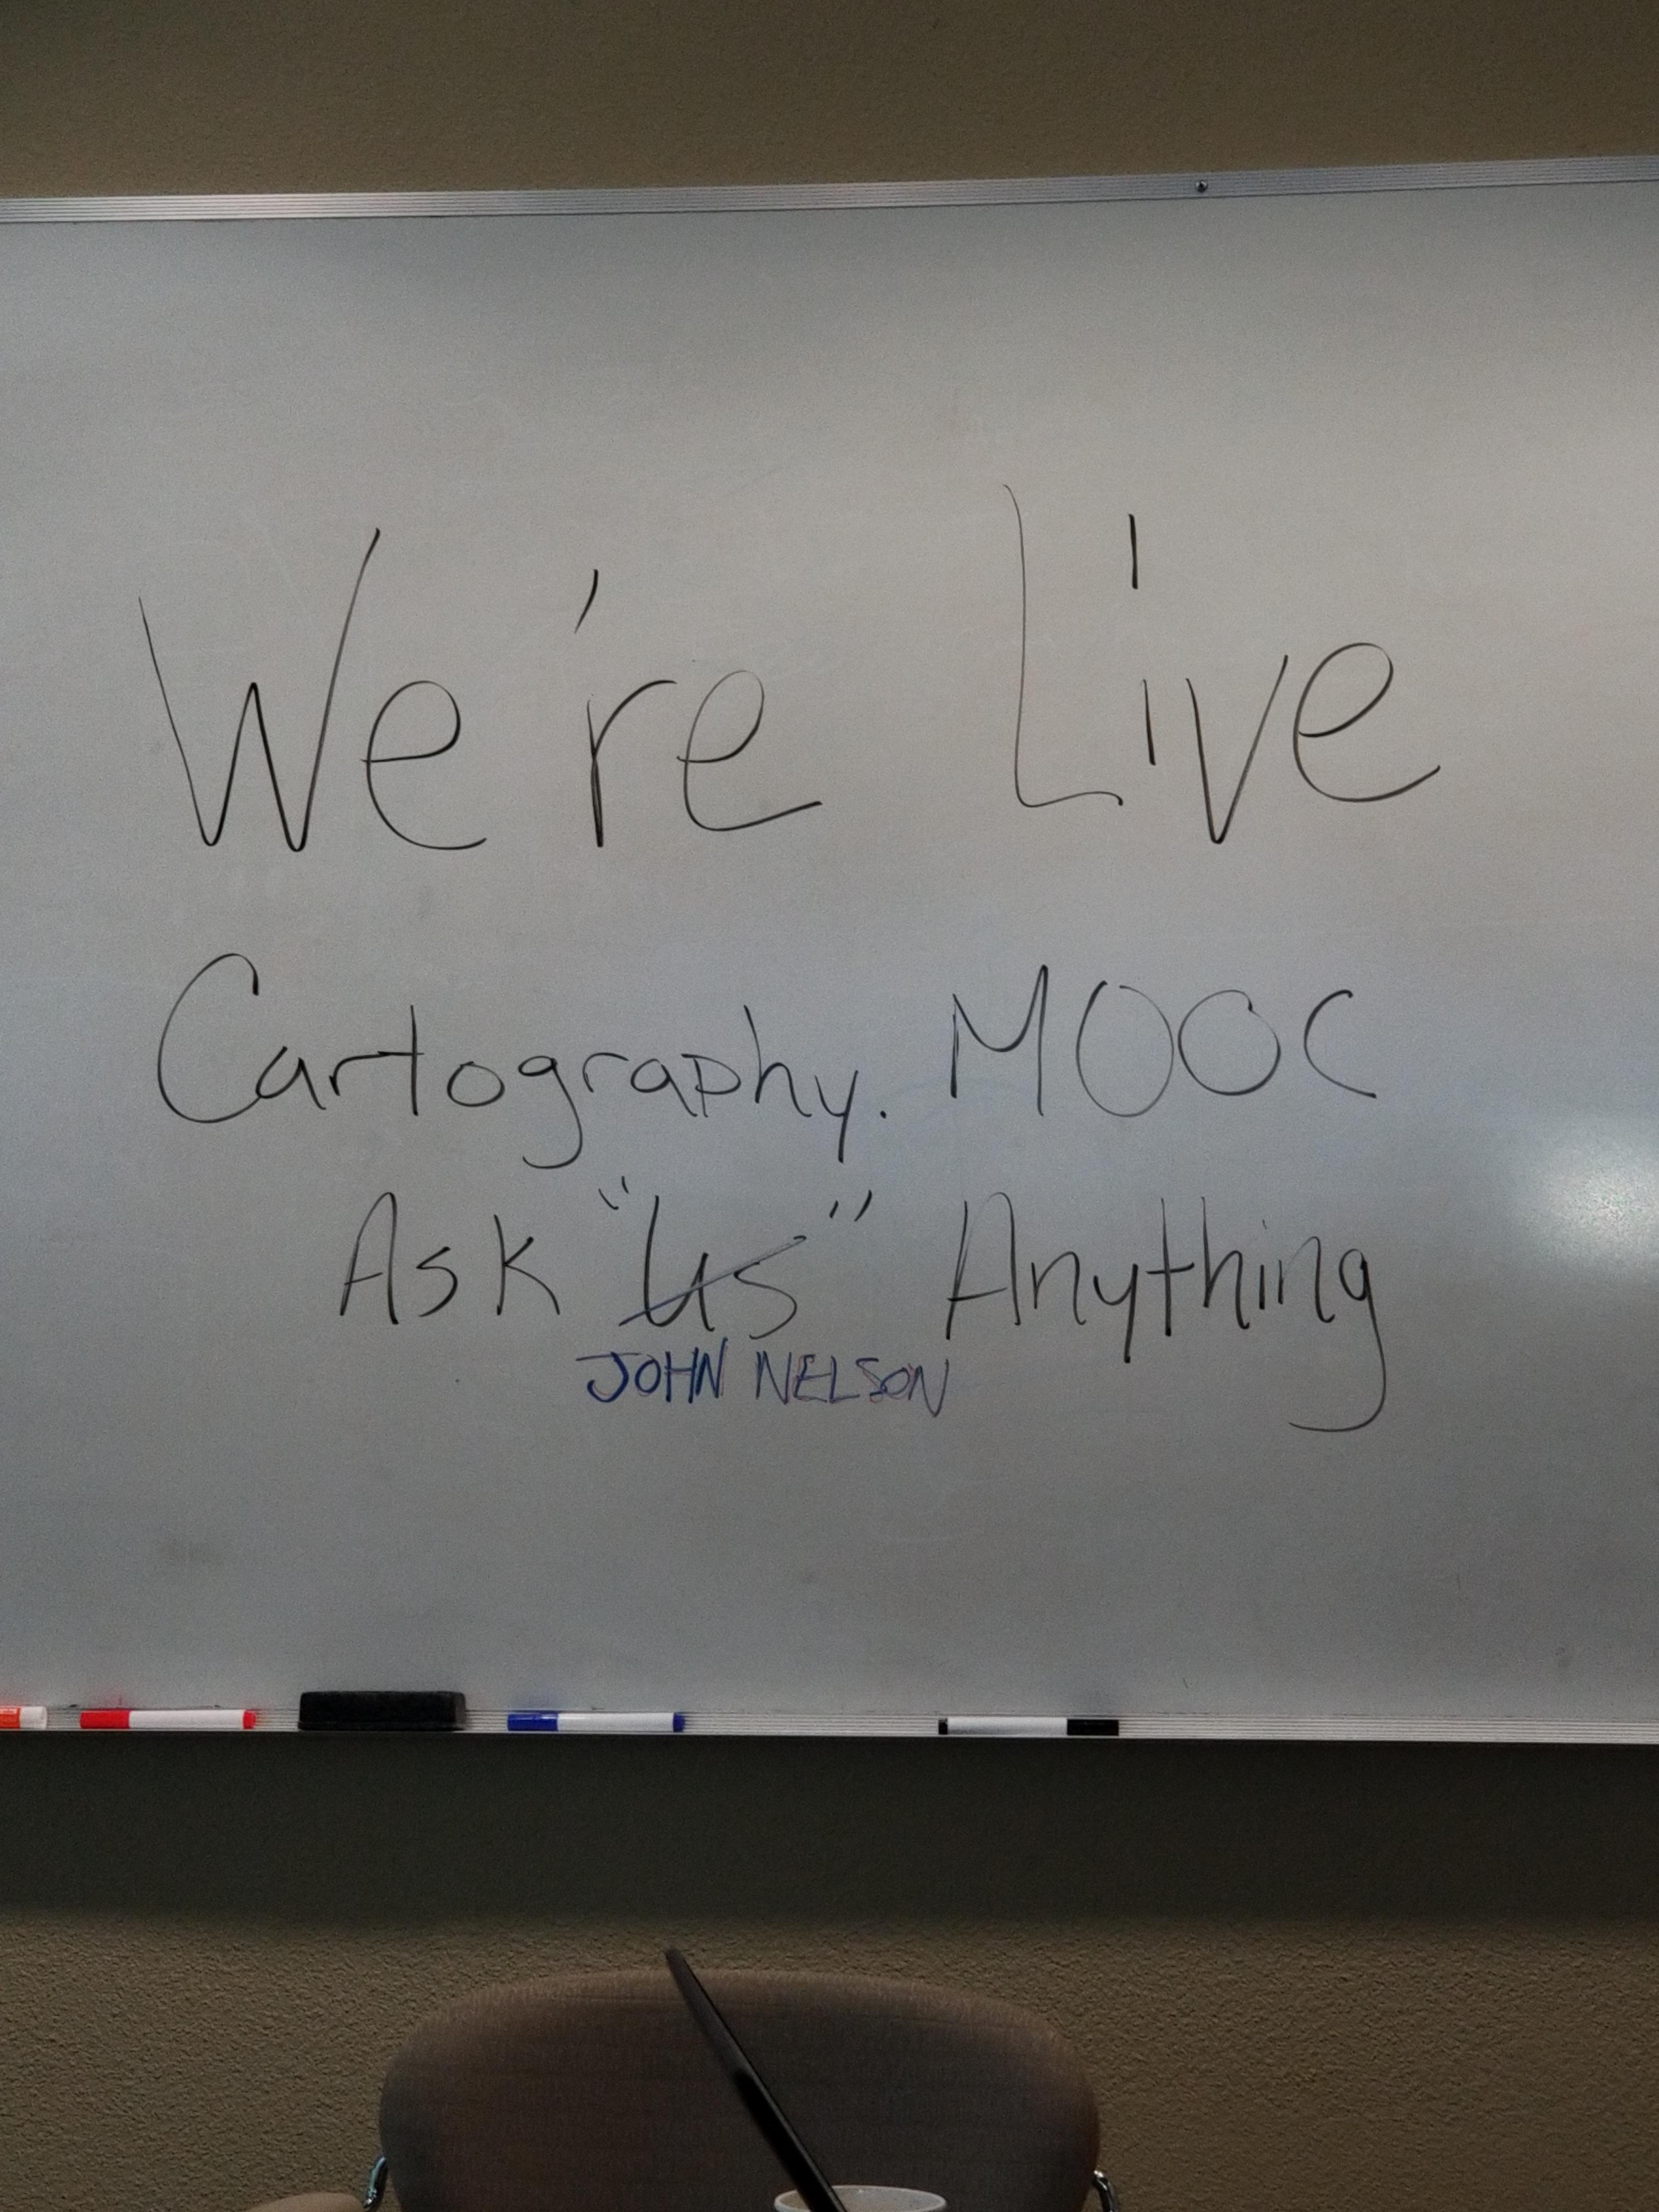 |
9:30 a.m. - And we're live! Go ahead and ask your questions!
9:45 a.m. - If you are just joining us, feel free to ask any question.
10:00 a.m. - We're halfway through, Great questions! Keep them coming!
10:15 a.m. - If you are just joining us, feel free to ask any question.
10:25 a.m. - Five minutes to go! Got any fun questions for our Guests?
10:30 a.m. - And that's a wrap! The live AMA has ended with our wonderful Cartography. MOOC Guests.
Thank you for your questions and participation.
The thread has shifted to a time-stamp view. To view the threads in their entirety, you can select the Actions above the right corner of the discussion thread and select View PDF.
- Mark as New
- Bookmark
- Subscribe
- Mute
- Subscribe to RSS Feed
- Permalink
Hello,
I'm currently taking the MOOC Cartography course and it has been stressed when making choropleth maps (graduated colors for instance) you should not map totals with a choropleth map because the areas and base population data differ between areas, creating problems when comparing areas across the map. I'm still confused as to why. I'll give an example of my thought process.
I have data for Minnesota that tells the change in number of trees per county. I want to make a map choropleth map that shows this. My thinking is to show a map that has counties colored from a dark red when negative through a dark green when they're positive. I am not understanding why I need to normalize the data based on the area of the county. I mean, I understand if you were trying to show a percent change based on area or if you were wanting to know out of the total number of trees as a proportion of the county area but if you just want to give whole total numbers I'm not getting.
Can you please explain this? Thank you!
- Mark as New
- Bookmark
- Subscribe
- Mute
- Subscribe to RSS Feed
- Permalink
Bryan,
You say your data shows the "change in number of trees per county", that means this data is not a single total but a rate and is already normalized by county. The word "per" means "for each" (used to express a ratio or rate). So if the "change" is 32 trees per county then the rate is (32 trees)/(1 county), i.e., a fraction whose numerator is a count of trees and denominator is a count of county's. If you want to normalize by area, then the numerator would still be the physical count of trees, but now the denominator would be the area in whatever units you want to use (square feet, square miles, acres, whatever). Just make sure that each denominator has the same units. If county A has 235 acres then county B must also be converted to acres to normalize the data.
Hope this makes sense. If not I would be more than happy to try and re-explain.
- Mark as New
- Bookmark
- Subscribe
- Mute
- Subscribe to RSS Feed
- Permalink
If you have an area that is 10 by 10 and an area that is 100 by 100, all things being equal you'd imagine thgat your density of trees is the same right? So that you might have 10 trees per sq km in the first area and 10 trees per sq kn in the second area. On a choropleth, our brains are automatically see larger areas as 'more' anyway so it's vital to couter the way in which our brains interpret that relative to the data being mapped. In this case it's critical to map density - both 10 trees per sq km and, so, use the same shade of whatever colour (let's say green eh?). If you mapped totals the first area might have 10 but the second area 100, even though the densities are the same. the totals are only different by virtue of the area size...not the distribution of the data itself. So if you map the first area in a lighter green and the second area as darker your brain is thinking density yet your eyes just see 'more and propogate the error.
It's really a simple fix if you want to continue to map totals - just use a technique that supports totals like a proportional symbol map. here, the size of the symbol itself is used to represent the data so it can change size when totals change. Remember, we can't change the sizes of the areas on a choropleth. We're stuck with them so we have to accommodate them in different ways.
In basic terms it's our eyes and brains that read maps in a subcontious way and cannot overcome the limitations of the choropleth technique. So we have to do the hard work in making the map right and making the right map so we can trust what we see.
Normalizing is for polygonal data - for choropleth maps. You convert the total for each area to some rate or ratio for that area. So, it would be persons per sq mile, or per capita, or per 100,000, or as a percentage. But always for the same area. That way, you are 'normalising' each area by the same denominator for each area, accounting for the inherant differences. It's not really the choropleth map that needs normalizing...it's the data which, un-normalized, causes the symbology to be incorrectly seen by our very human eyes and brains. We're useless at accounting for unseen differences between areas so we rely solely on what we see. If a map is symbolised showing less and more, of totals, that's what we see...and we process it erroneously to mean something that isn't actually in the data.
I hope that helps
- Mark as New
- Bookmark
- Subscribe
- Mute
- Subscribe to RSS Feed
- Permalink
Greetings All,
As GIS technology becomes easier to use and more ubiquitous, what advice can you give GIS professionals who feel a sense of displacement in the industry?
Enterprise GIS positions are becoming more available and tend to focus more on the programming side and integrating GIS capabilities into new ERP systems, how do we reconcile traditional GIS work with the more modern IT side? With more private organizations positioning GIS as part of the IT department, how do we co-exist in the plan, build, run world that limits the type of GIS work we do?
Industry professionals have oft touted learning to program or developing a speciality alongside our GIS skills. I found that the general thought is that it is easier to teach a traditional computer scientist geospatial concepts than it is to teach a GIS professional with programming background to develop an app. Data Scientists are increasingly able to run spatial analysis using R-packages and GDAL scripts. These can sometimes lead to massive CartoFails!
What advice can you give to those adapting to the changing work types where we don't get to use our Cartographic and more traditional GIS skills learned in this and other MOOCs? Help us put the 'G' back into IS!
- Mark as New
- Bookmark
- Subscribe
- Mute
- Subscribe to RSS Feed
- Permalink
Great question and probably beyond the scope of a single, simple answer. From my perspective, you can't be an expert in everything. I lost my ability to code quite some time ago. I collaborate with others who have those skill sets so we can help each other. that said, there has always been a certain amount of re-tooling as cartographic technology changes. I started off with photomechanical and have been through all sorts of CAD, desktop design, illustration and GIS workflows since. you have to accept a certain amount of adaptation is necessary to keep pace. But if you have cartographic skills, make sure they are heard. We all face the prospect of those with other specialisms thinking they also know every other corner of geo. be heard. Show them the difference great work makes. Quality, not quantiy. Be smarter. Excellence does rise to the top though sometimes you have to shout pretty liud to be heard.
- Mark as New
- Bookmark
- Subscribe
- Mute
- Subscribe to RSS Feed
- Permalink
Halo,
I'm wowed by the brilliance of the colors in the thematic maps of this MOOC. They seem almost unreal. My reality is b/w maps. Here are two scenarios.
1. For some of us, in academia, for example, color printers are being removed and replaced with less expensive b/w printers. Hard copy maps, and they do still exist, therefore lose their "punch" in monochromatic graphical environment.
2. At a public hearing/meeting, my PowerPoint projected onto the meeting room screen displays thematic maps in brilliant colors. Reproduction budget only permits distribution of b/w print-outs to those in the audience. How can the "point" of the map be made emphatically in b/w so those taking maps with them will have as strong a visual impression at home as at the pubic presentation?
How would this MOOC be re-designed to accommodate generating hard copy that is only in black, white, & shades of gray? In other words, how could this course emphasize Ansel Adams rather than Jackson Pollock?
- Mark as New
- Bookmark
- Subscribe
- Mute
- Subscribe to RSS Feed
- Permalink
Ryan, I happen to think that black white and grey maps can be really beautiful! They may take more planning and/or work, but to me, there's nothing more beautiful than a really well-done monochrome map. **I'm not saying I'm any good at making them... 😉
- Mark as New
- Bookmark
- Subscribe
- Mute
- Subscribe to RSS Feed
- Permalink
Great question. Monochrome maps (or even two colour) are often some of the hardest to design. The key is in constrast. With colour maps you have an extended palette. In black and white you're really working with one colour (black on white) and simply varying the contrast. You have to stretch the foreground from the background even further, Use masks and spacing. Amek symbols even simpler ad clearer. making a black and white map isn't just about tuning out the colour. It often requires a redesign.
- Mark as New
- Bookmark
- Subscribe
- Mute
- Subscribe to RSS Feed
- Permalink
Hey! Thanks ESRI team for this interesting and informative international MOOC event.
So I have two main questions.
1 - What about prices for your products!? How much does Arcgis Online subscription cost? They are not displayed anywhere,
2 - Is it possible to find freelance cartography job related with ArcGIS and how to do that?