- Home
- :
- All Communities
- :
- Services
- :
- Esri Training
- :
- Esri Training Matters Blog
- :
- Improving a Density Analysis Using Attributes
Improving a Density Analysis Using Attributes
- Subscribe to RSS Feed
- Mark as New
- Mark as Read
- Bookmark
- Subscribe
- Printer Friendly Page
Density analysis calculates the number of events or objects across an area. The calculation results reveal where the highest concentration of points is within that area.
Did you know that you can also analyze points that represent a value greater than 1? Just because there may be a cluster of points does not necessarily mean that a certain area has the highest concentration.
All you need is an attribute with the quantities.
The following example shows you how density analysis is performed using attributes with the Point Density tool in ArcGIS Pro 2.2.
This map shows the address locations of reported crimes.
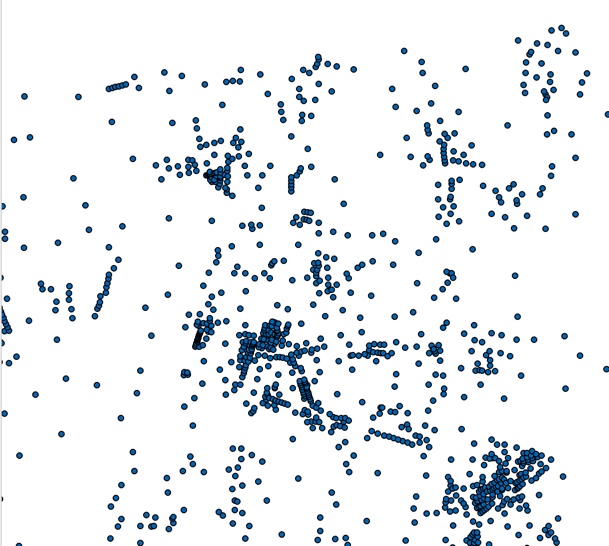
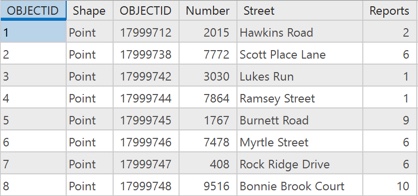
Each point may represent more than one report. The number of reports is stored in the Reports field in the attribute table.
- On the Analysis tab, click Tools.
- In the search box, type Point Density.
- On the Analysis tab, click Tools.
- Select your input points.
- For Population field, select the attribute with the quantity value.
Your Point Density geoprocessing pane should look something like this:
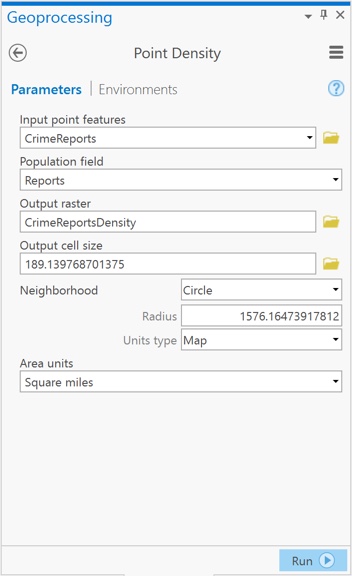
- Set your output raster.
The output density raster shows the areas with the highest density based upon the number of reports at each address location. When you compare running the Point Density tool without a population field versus with a population field, you can see the difference in the results.
Point density without population |
Point density with population |
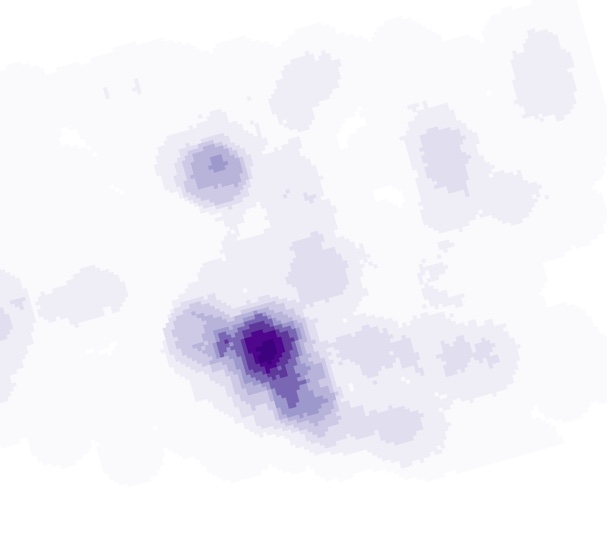
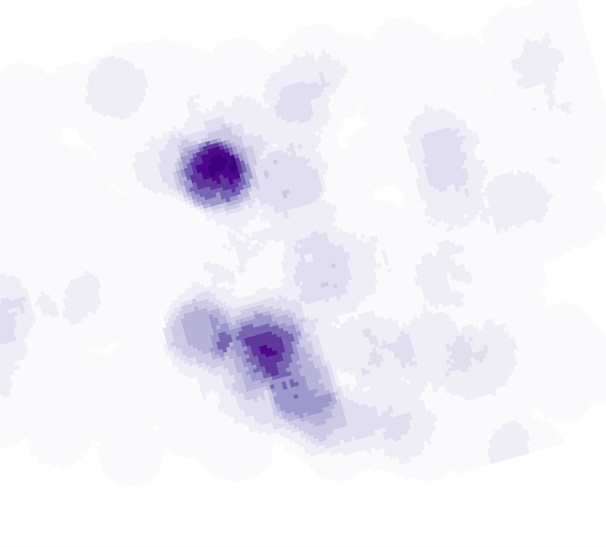
By adding in the population field, a high-density area becomes more apparent in the northern area of the map. Upon further investigation, that particular area contains a mall, shopping center, and movie theatre—which probably contributes to the higher number of crime reports.
Spatial analysis provides the tools you need to make informed decisions. Learning how to use the available tools will help you choose the specific analysis tool that will best meet your particular needs.
Are you new to spatial analysis? I suggest that you take a look at the Getting Started with Spatial Analysis web course. This course builds a foundation of knowledge on the six categories of spatial analysis and how they are used in the spatial analysis workflow. Additional information on density analysis can be found in the Calculating Density Using ArcGIS web course.
*Note: The data used in this example is fictitious and does not represent real crime data.
You must be a registered user to add a comment. If you've already registered, sign in. Otherwise, register and sign in.
-
ArcGIS Desktop
28 -
ArcGIS Step by Step
46 -
Class Resources
25 -
e-Learning
64 -
MOOCs
31 -
Software Demos
11 -
Technical Certification
17