- Home
- :
- All Communities
- :
- Services
- :
- Esri Training
- :
- Esri Training Matters Blog
- :
- Commonsense Tips for Story Map Data
Commonsense Tips for Story Map Data
- Subscribe to RSS Feed
- Mark as New
- Mark as Read
- Bookmark
- Subscribe
- Printer Friendly Page
Making a story map is an excellent opportunity to be creative, challenge your inner cartographer, and demonstrate GIS skills (and add pizzazz to your LinkedIn profile while you're at it). If you haven't yet made a story map, this four-step process may help you get started.
Number 2 in the process is to plan and execute your data strategy. This step is critical but can get glossed over in the creative excitement to make a cool map. It's time to give it some time in the spotlight.
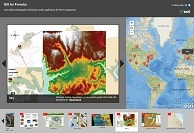
A lot of story maps are focused narratives about geographic places, features, and current or historic events. When considering data to support a story map project, pay particular attention to three items.
- Locational Accuracy
- Currentness
- Understandableness
Locational Accuracy
The story map topic determines how locationally accurate your data needs to be. If you're making a map tour or shortlist, odds are you're showcasing point features. Depending on the real-world features represented by the points, map viewers may have accuracy expectations that you'll want to meet. Keep in mind that the prettiest, most topically engaging map is a dud if the features shown are far from their real-world locations.
Suppose the topic is a local garden tour and the source data is a list of the participating homes' street addresses. The map is large-scale and uses a basemap that includes streets, parcels, and building footprints. In this case, map viewers will reasonably expect the house points to be on the correct city block and on the correct side of the street. If the points are not displayed at that level of accuracy, it detracts from the story map.
If you don't know which side of the street point features fall on, let the ArcGIS Online map viewer's geocoder do the work for you. Save addresses, GPX coordinates, or lat-long coordinates in a text or CSV file, then upload the file to the map viewer.
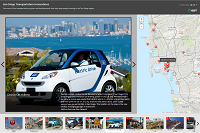
If you're making a map tour in which images and text are the meat of your story, you probably don't need submeter accuracy. It's perfectly fine to represent an entire street as a single point feature. As long as the points are reasonably close to the real-world locations, the story works.
Currentness
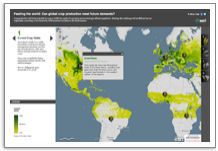
Unless you're presenting a historical topic or a temporal analysis of a current issue, seek out current data. You can find lots of up-to-date, authoritative maps and data on ArcGIS Online.
If you use obsolete data to present a current topic, you run a high risk of creating a misleading or totally inaccurate story map. For example, using 1990 U.S. census data as the basis for a story map about current U.S. demographics is a do-not because more current census data is readily available. In this case, the 1990 data is obsolete.
On the other hand, if the topic is how U.S. demographics have changed over the last 20 years, using 1990 census data in conjunction with 2000 and 2010 census data is the sound approach (and the Swipe or Map Series story map apps would work well). In this case, the data is old but not obsolete.
Understandableness
This possibly invented term relates to the usability index of your data, meaning can users interpret it at a glance or do they need to metaphorically lean in and squint? This item creeps into step 3 territory (create the web map), but an important part of planning your data strategy is thinking about the final presentation. Often, preprocessing data speeds up assembly of the end product.
A story map is a focused narrative, so delete any fields or features that aren't relevant to that narrative. Conversely, if your data doesn't include all the detail you want to present, add one or more fields with the desired information (e.g., text descriptions, website URLs, image URLs, or category codes to base feature symbology on). You may need to split attributes stored in one field into separate fields to enhance usability of feature pop-ups.
After you've finished preparing your data for story mapping, you're ready to add it to a web map, which you'll then share to become the foundation of a story map app. As mentioned previously, using the ArcGIS Online map viewer is an easy way to create a web map. You can upload a service, zipped shapefile, TXT file, GPX file, or CSV file.
- Note: When using an ArcGIS Online public account to create a story map, you can upload a maximum of 250 features at a time. If your dataset includes more than 250 features, reduce the number of features or split the dataset into multiple files and upload them separately (first plan out how to group the features into a logical set of map layers).
If the data you want to use for a story map is stored in a geodatabase feature class and you aren't able to (or don't want to) create a service, it's easy to export the feature class to a shapefile.
- In the ArcMap Catalog window, right-click the feature class and click Export > To Shapefile.
- In the Feature Class to Feature Class dialog box, you can build a query to export only certain features and you can remove fields that you don't need.
- Shapefile text fields have a 254-character limit. If the source feature class has a text field that stores more than 254 characters, the text on the web map will be truncated. Always examine your source data carefully and make any necessary adjustments before exporting.
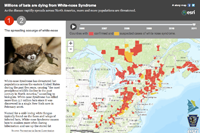
Symbology plays a big role in data understandableness, particularly when it comes to quantitative (numeric) data. Exercise caution when mapping quantitative data—it's easy to unintentionally use symbology that turns perfectly accurate numbers into an inaccurate view of reality. For example, pie chart symbols are often used incorrectly to symbolize data that does not represent part of a whole.
When presenting quantitative data, a good practice is to cite the data source. At a minimum, document who collected the data and when. You could add this information to the story map introduction panel, legend, feature pop-ups, or another appropriate text element.
One final tip that has nothing to do with data: Be sure to add your byline and perhaps a custom logo to the story map. After all your hard work, you deserve the recognition and map viewers will appreciate knowing who created the story map.
True beauty comes from the inside, so goes the saying. When it comes to maps, true beauty comes from accurately located, current data, presented understandably with valid symbology.
Planning and executing your data strategy may take a little time and effort, but the reward is an authoritative map that will engage and educate. In other words, a story map that's beautiful both on the outside and on the inside.
Related post:
You must be a registered user to add a comment. If you've already registered, sign in. Otherwise, register and sign in.
-
ArcGIS Desktop
28 -
ArcGIS Step by Step
46 -
Class Resources
25 -
e-Learning
63 -
MOOCs
30 -
Software Demos
11 -
Technical Certification
16