Turn on suggestions
Auto-suggest helps you quickly narrow down your search results by suggesting possible matches as you type.
Cancel
- Home
- :
- All Communities
- :
- Services
- :
- Esri Training
- :
- Esri Training Matters Blog
- :
- A Fast Way to Symbolize Features of Interest
A Fast Way to Symbolize Features of Interest
Subscribe
918
0
12-11-2008 04:07 PM
- Subscribe to RSS Feed
- Mark as New
- Mark as Read
- Bookmark
- Subscribe
- Printer Friendly Page
12-11-2008
04:07 PM
New ArcGIS users often want to symbolize certain features in a layer so that those features stand out on the map, but they aren't sure how best to go about it, especially if they don't want to make a copy of their data. There's an easy way to accomplish this, and this post describes how.
A fast way to get the desired result is to create a unique values legend. When you use a unique values legend, features with the same specified attribute value are given the same symbol. However, with unique values it's easy to assign all the features in a layer the same symbol, then interactively select features of interest and symbolize them differently. Step-by-Step Example
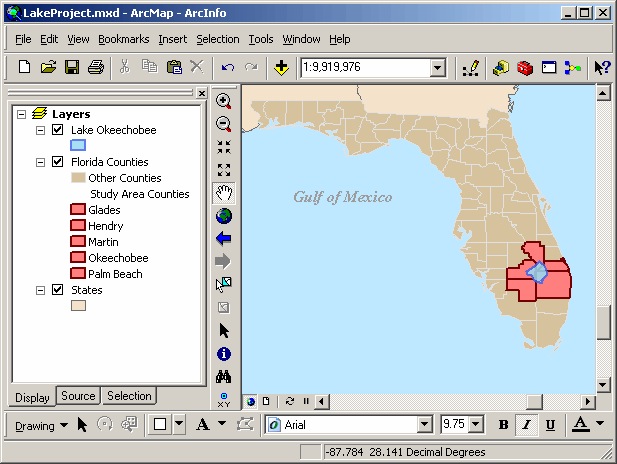
For this example, suppose you are researching factors that impact the water quality of Lake Okeechobee in Florida. Your study area is the counties that border the lake. You have a layer representing the lake and a layer of all Florida counties. You want to create a simple map that shows the study area, then export the map as a graphic to include in your report.
In the symbol area, there is one default symbol with "all other values" displayed next to it.
Back in the symbol area of the Layer Properties dialog box, the symbols for the counties you just added are all unique (a different color). You want them to have the same symbol.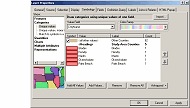 Note: Sometimes the outline of the symbols for the features of interest will be obscured by the symbols for the other features. To make sure the unique symbols are most prominent, you can set the symbol levels for the layer.
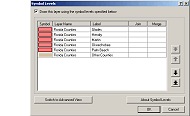
For this example, you would want to zoom into the study area counties and display their labels (use the Label Manager to create a label class that labels only the counties of interest—see our previous post about creating label classes).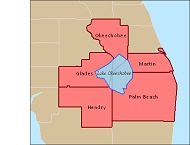
You could export the zoomed-in map to a graphic file (File menu > Export Map), then zoom back to the previous map extent and export the map showing the location of the study area within the state. Both map graphics could be inserted into your report to provide visual context.
That's it. Using basic functionality available through the Layer Properties dialog box, you can quickly create symbology to enhance a simple mapping project.
To assign a different symbol to one or a few features in a layer, you could also:
These methods have their advantages. But for a quick job, the unique values approach works well.
A fast way to get the desired result is to create a unique values legend. When you use a unique values legend, features with the same specified attribute value are given the same symbol. However, with unique values it's easy to assign all the features in a layer the same symbol, then interactively select features of interest and symbolize them differently. Step-by-Step Example
For this example, suppose you are researching factors that impact the water quality of Lake Okeechobee in Florida. Your study area is the counties that border the lake. You have a layer representing the lake and a layer of all Florida counties. You want to create a simple map that shows the study area, then export the map as a graphic to include in your report.
- Add the data to a new map document.
- Double-click the county layer name in the Table of Contents to open its Layer Properties dialog box.
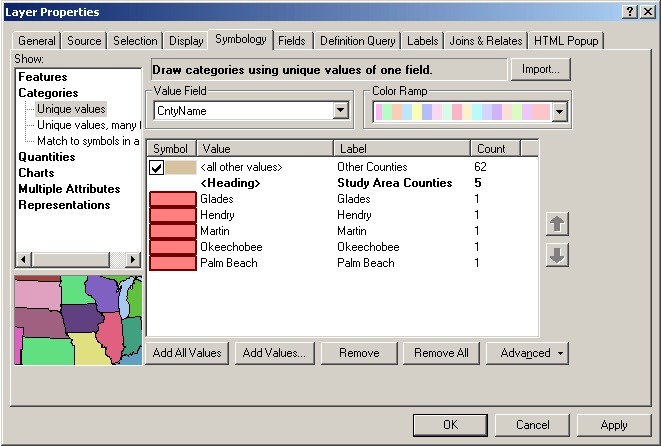
- In the Symbology tab's Show area on the left side of the dialog box, click Categories. Unique values is selected by default.
- On the right choose the Value Field you want to symbolize on in the drop-down list. In this example, we choose the field that stores the county names.
In the symbol area, there is one default symbol with "all other values" displayed next to it.
- Click the Add Values button.
- In the Add Values dialog box, choose the counties that border the lake. You can hold down the Ctrl key to select multiple counties in the list. Click OK.
Back in the symbol area of the Layer Properties dialog box, the symbols for the counties you just added are all unique (a different color). You want them to have the same symbol.
- Hold down your Shift key and click the top county name symbol (not the "all other values" symbol), then click the bottom symbol so that all the unique county symbols are selected. Right-click the selection and choose Properties for Selected Symbols.
- In the Symbol Editor, set the desired symbol properties (color, size, etc.), then click OK. We chose a light red fill and a darker red outline with a width of 1.5.
- Double-click the symbol for "all other values," use the Symbol Editor to set its properties, then click OK.
- Click in the Label column for the "all other values" symbol and type in the text that you want to display next to that symbol in the Table of Contents. You can also edit or delete the default heading text that will display over the unique county symbols if you want.
 Note: Sometimes the outline of the symbols for the features of interest will be obscured by the symbols for the other features. To make sure the unique symbols are most prominent, you can set the symbol levels for the layer.
- Below the symbol area in the Layer Properties dialog box, click Advanced > Symbol Levels.
- In the dialog box, select the symbol you want to be least prominent and click the Move to Bottom arrow button to move it to the bottom of the list.
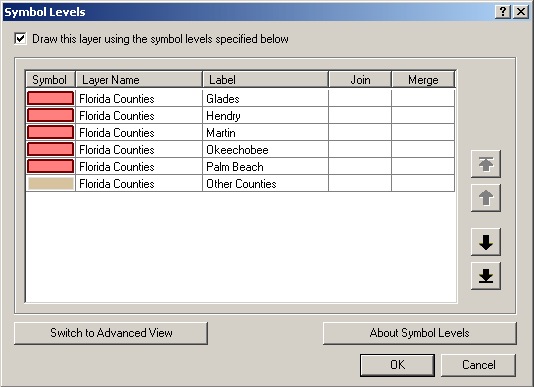
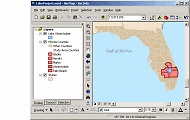
- Click OK, then click OK again to close the Layer Properties dialog box and examine the map.
For this example, you would want to zoom into the study area counties and display their labels (use the Label Manager to create a label class that labels only the counties of interest—see our previous post about creating label classes).
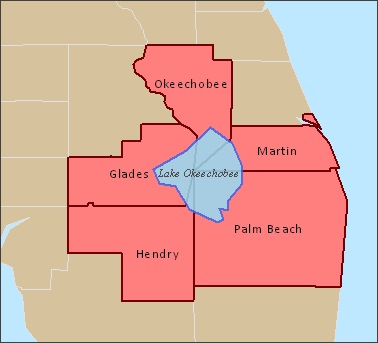
You could export the zoomed-in map to a graphic file (File menu > Export Map), then zoom back to the previous map extent and export the map showing the location of the study area within the state. Both map graphics could be inserted into your report to provide visual context.
That's it. Using basic functionality available through the Layer Properties dialog box, you can quickly create symbology to enhance a simple mapping project.
To assign a different symbol to one or a few features in a layer, you could also:
- Make a copy of the layer and do a definition query on the copy to display only the features of interest.
- In the original layer, select the features of interest and then create a selection layer of them.
These methods have their advantages. But for a quick job, the unique values approach works well.
Labels
You must be a registered user to add a comment. If you've already registered, sign in. Otherwise, register and sign in.
About the Author
Suzanne is a Maryland native who enjoys writing about Esri technology, GIS professional development, and other topics. She is the Training Marketing Manager with Esri Training Services in Redlands, California.
Labels
-
ArcGIS Desktop
26 -
ArcGIS Step by Step
46 -
Class Resources
18 -
e-Learning
62 -
MOOCs
28 -
Software Demos
10 -
Technical Certification
16