- Home
- :
- All Communities
- :
- Products
- :
- Data Management
- :
- Data Management Questions
- :
- Re: Time scale in a bubble graph
- Subscribe to RSS Feed
- Mark Topic as New
- Mark Topic as Read
- Float this Topic for Current User
- Bookmark
- Subscribe
- Mute
- Printer Friendly Page
Time scale in a bubble graph
- Mark as New
- Bookmark
- Subscribe
- Mute
- Subscribe to RSS Feed
- Permalink
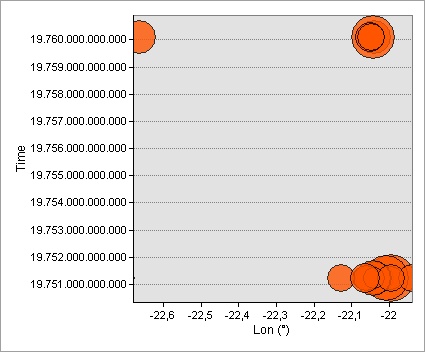
Hi, I would like to make a bubble graph in ArcMap, where the Y-axis is in a time format (YYYYMMDDhhmmss), but ArcMap does not seem to recognize that this is a time. It treats this time format as a regular number, and therefore the time scale in the graph is messed up (i.e. dates of the month go up to 100 instead of ca. 30 etc.). I have clicked „enable time on this layer“ in Properties and set the field format according to the time format, but it does not seem to matter. Any ideas how to make a bubble graph understand time?
The time scale is supposed to be from December 1975 to January 1976 (ArcMap added the dots (.) to the time scale, it does not have dots in the Attribute table).
- Mark as New
- Bookmark
- Subscribe
- Mute
- Subscribe to RSS Feed
- Permalink
I hate working with dates for this reason...
Perhaps converting the datetime objects to a numeric scale beginning with your start time
import datetime
n = datetime.datetime.now() # now... well it was
n_ord = n.toordinal() # Gregorian ordinal
n_10 = n_ord + 10
f = datetime.datetime.fromordinal(n_10)
#
n
datetime.datetime(2017, 8, 28, 6, 37, 5, 823933)
#
f
datetime.datetime(2017, 9, 7, 0, 0)