Coordinate Reference Systems Blog - Page 3

cancel
Showing results for 
Show  only  | Search instead for 
Did you mean: 

Latest Activity

(30 Posts)
SimonKettle
Regular Contributor

Introduction

Considering the de facto use of the European datum of 1950 (ED50) throughout the oil industry operating in Northern Europe and the North Sea, I thought it would be interesting to explore this datum’s history and how it came to be the first European continent-wide datum. During the research for this project I uncovered a fasinating story of military intelligence during the Second World War. But first we must set the scene and go back to...

European Geodesy at the Turn of the 20th Century

“The first-order triangulation of Europe [was completed] over the last 200 years” (Hough, 1948)

Prior to World War Two (WW2), Europe was divided into a jumble of independent national and sub-national geodetic datums with their own centre point, triangulation networks and ellipsoids only sometimes connecting to their neighbour’s triangulation effort along the borders.

Central Europe during the late 19th to early 20th Century is a prime example of this situation. Within the German Confederation and other German States their existed nearly as many datum’s as there were political entities (e.g. Hannover (Gauss, 1821); Bavaria (Soldner, 1808-1828), Prussia (Schreiber, 1975), Württemberg etc). Each of these states contained a survey office directing surveying activities. One of the attempts to connect various datums was during the First German Reich. The Reiehsdreieeksnetz began in Prussia through the Preußische Landesaufnahme (Prussian State Survey) along the Baltic coast as far as Berlin and Lübesk. This triangulation was continued under orders for the survey of Hannover by King George IV (the Hannover triangulation is known as Hannoversche triangle chain).

These networks had their origin normally at a major observatory such as Greenwich in London, Pulkovo near St. Petersburg and the Pantheon in Paris. Additionally these datums referenced a variety of ellipsoids making transformation calculations difficult. However a common more fundamental problem summarised by Hough (1948), on the original triangulation of Germany, was that...

“…no attempt [was made] to minimize the effect of the deflection of the vertical at the initial station” Hough (1948)

...and therefore errors in position were found at the place of joining to other triangulation networks before any transformation had even been started.

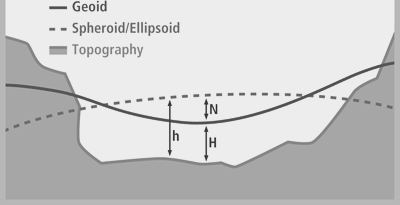
The direction of the vertical is defined by a local plumbline, where a survey instrument is set up to measure the horizontal plane that is exactly perpendicular to the vertical. The ellipsoid normal through the same point is perpendicular to the local tangent to the ellipse. However due to variations of gravity, the two are not necessarily coincident. The difference is called deflection-of-the-vertical.

Other technical issues existed for trying to connect existing triangulations. The connection between the New Triangulation of France (NTF) Datum and the Belgian Datum of 1927 is an example where the connecting of triangulation networks was insufficiently calculated. A calculation was conducted to find the difference in longitudinal values between Brussels and Greenwich. However this was result was not  incorporated in the joining of the triangulation networks and hence left large errors for the connection of the networks.

Germany - An example of “first order triangulation”

Since the formation of the First German Reich after unification in 1871, efforts had been made to standardise triangulation across the country beginning to solve some of the issues mentioned above. However, state military survey organisations within the German army produced uncoordinated products throughout the period up to the end of WW1, perhaps indicating disloyalty within the newly unified country. This lack of coordinatation and communication between survey organisations led to some poor quality mapping products being produced during the First World War (see Cruickshank, 2006 for more details).

After the First World War and the Treaty of Versailles in 1919 a reduction in military staff led to the demilitarisation of survey groups and the establishment of Reichsamt für Landesaufnahme (Reich Office for State Survey) who led an overhaul of Germany's mulitiple triangulations. A “Neutriangulation” of Bavaria, Baden, Württenberg, Silesia, Pomerania, Mecklenburg and Schleswig-Holstein took place in 1925. This “Neutriangulation” can been noted as a geodetic manifestation in the balance of power from the German Provinces.

As political tensions rose during the 1920 – 1930’s, driven in part by the dire economic situation throughout Germany and global depression, extremes in the political arena took hold eventually leading to the events that resulted in the rise of Nazism. Adolf Hitler and the Nazi party took hold of the country via emergency decree on 27th February 1933 after the Reichstag fire.

Development of a Military Survey

After the seizing of power by the Nazi’s Germany no longer cooperated according to the Treaty of Versailles, restoring pre-war military institutions and a 9th Division to the General Staff of the Army, known as the Military Survey (Reichsamt Kriegskarten und Vermessungswesen, see details about the organisation in Cruickshank, 2005). In 1936 Lt. Colonel Hemmerich was appointed Department Chief. Under Hemmerich’s leadership the division dealt with the collection, evaluation, cataloguing and co-ordination of foreign maps and geodetic data, which were collated and reported in the ‘Planhefte’. These became major publications of the German Military Survey.

Hemmerich.png
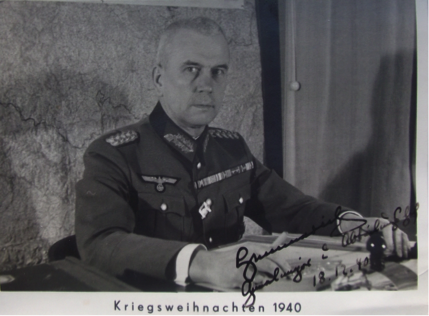
Figure 1 Lt. Colonel Hemmerich (image from http://disturbedgeographer.com)

The development of the military survey coincided with early attempts by the Minister of the Interior to create a A Neuordnung des Vermessungswesens (New Order of Survey and Mapping) and by 1936 Survey Commissars were established throughout the regions of the now Third Reich. These commissars were also the local political leaders of individual states.

“In 1936 the German main triangulation network was readjusted. Since considerable portions were introduced into the readjustment without any modification and since others had not yet been observed completely, the readjustment could be carried out in parts only.”
Hough 1948

An attempt by the German's to create an early equivalent of the European Datum was started in preparation for, and developed throughout,  the Second World War. This was due to the failings of the pre-First World War military survey activity that resulted in poor location plots and the use of old data (see Cruickshank, 2006 for a detailed discussion). During the inter-war period lessons were drawn from the experience of the First World War,  in particular about the importance of collecting up-to-date foreign maps and geodetic data.

With war imminent in August 1939, the Military Survey was mobilized and made ready to be attached to the individual commanding authorities within the Germany Army. These geodetic units followed the German army into field of operations that by 1942 occupied the vast majority of Europe and Northern Africa.

World_War_II_in_Europe%2C_1942.svgFigure 2 Maximum Extent of Nazi Germany during World War 2 (image taken from wikipedia)

From this military position work began on the establishment of a single unified geodetic framework for the whole of continental Europe (including Northern Africa). Hemmerich’s division uniquely had control of nearly every geodetic department in Europe and thus controlled the expansion of a wealth of knowledge and equipment that would allow the Germans to accurately survey Europe. It is this work, carried out by Hemmerich’s division during the Second World War, that sowed the seeds for the creation of the European Datum.

Hemmerich lost his commanding post on 05th April 1945 where he was resigned to the Führerreserve and later arrested and imprisoned by Allied forces until 04 June 1947.

Next time we shall have a look at the development of the European Datum from the side of the allies and explore the story of the military intelligence division code named the HOUGHTEAM.


[1]This discrepancy was one of the major factors that prompted the recomputation of all geodetic control in Western Europe after the First World War. The Bonne Grid “New Convention” is also referred to as the “Orange Report Net Grid” and was used through WWII until 1950.

References

Cruickshank, J. L., 2005. “The Reichsamt fur Landesaufnahme and the Ordnance Survey (Part 1)”. Sheetlines, 72, pp.9-22

Cruickshank, J. L., 2006. “Kaiser Bill thought he knew where you lived”. Sheetlines, 77, pp.5-20

Hough, F., (1948) The adjustment of European first-order triangulation. Bulletin géodésique 7(1) pp35-41

more
1 0 4,133
SimonKettle
Regular Contributor

Whilst not a blog written out on this site I thought this link was worth sharing. It discusses geodetic integrity and provides some nice insights into geodesy in the Oil and Gas Industry...positional integrity is so important in natural resource exploration and production it forms an essential element of the expensive process of drilling and producing Earth's natural resource.

Managing geodetic risks in E&P - Exprodat Blog -

"Geodetic integrity plays a small but vital part in the success of every E&P venture. It’s basically like Vitamin C: you don’t need much of it, but you can’t live without it. A deficiency in geodetic controls will slowly lead to guaranteed damage: “geo-scurvy”."

The following blog lays out some examples of where positional accuracy has not been good enough outside of the Lake Peigneur Example.

blog_risk_img1.jpg

Managing geodetic risks in E&P - Exprodat Blog -

more
0 0 1,978
SimonKettle
Regular Contributor

What is an antipode?

Any point on the surface of a sphere, in this case the Earth, that lies diametrically opposite from a given point on the same surface, so that a line drawn between the two points through the center of the sphere forms a true diameter (e.g. through the Poles of a Sphere). The Antipodes islands of New Zealand, in the South Pacific, are named after this phenomenon because of there "closeness" to the antipodes of London.

The image below shows the relative distribution of landmasses on opposite sides of the Earth.

Antipodes_rect2160.png

How can you calculate the antipodal point for any point on the Earth's surface?

The method using decimal degrees:

Take the latitude and convert it to the opposite hemisphere. This is done by multiplying by minus 1 (e.g. -x * -1 = x).

The longitude is calculated by taking the maximum possible longitudinal value and subtracting the input longitude value. The if statements allow for "which way round the Earth" the calculation is conducted this is important because the values are bounded to +180 and -180. For example a longitude of -10 has an antipodal location of ((-180) - (-10))*-1 = 170.

# Original latitude and longitude values in Decimal Degrees
Latitude =  33.918861
Longitude = 18.4233

# Convert latitude to opposite hemisphere (e.g. −x* −1 = x)
AntiLatitide = Latitude *-1

print "Antipodal Latitude: " + str(AntiLatitide)

# Convert Longitude to opposite hemisphere (e.g. (180 - x)*-1 = y)
# Note this binds the maximum values to be -180 and 180 degrees
if Longitude > 0:
    AntiLongitude = (180 - Longitude)*-1
elif Longitude < 0:
    AntiLongitude = (-180 - Longitude)*-1

print "Antipodal Longitude: " + str(AntiLongitude)

A result...the Antipodal point of London

Combining the above code with the XY to Line tool allows me to construct a geodesic line joining the two points thus producing this result!

GeodeticLines.jpg

A free map calculating the antipodal point of any location:

http://www.freemaptools.com/tunnel-to-other-side-of-the-earth.html

more
0 0 2,859
SimonKettle
Regular Contributor

An easier place to search for coordinate systems...

If you need a quick and easy to use resource for coordinate systems search try: EPSG.io. This is an open source web-service providing a database based on the official EPSG database that is maintained by OGP Geomatics Committee.

You can quickly search for an area, name and type like any other web-search engines.

For Example searching "United Kingdom" and click on the British National Grid result produces the following page:

EPSGio.png

See below for a British National Grid example:

OSGB 1936 / British National Grid - United Kingdom Ordnance Survey - EPSG:27700

Some of the Key Features:

  • Easy full text search for the complete database of coordinate systems from EPSG
  • Short URLs that reference the EPSG code e.g. http://epsg.io/27700
  • Area of use for any CRS referenced on an embedded map
  • Export definitions in various formats

Check it out...it's free

more
1 2 1,930
SimonKettle
Regular Contributor

A common question asked when working with Coordinate Reference Systems (CRS) in ArcMap is not only how to transform between different CRS but simply what transformations are available between two CRS in a given area?

There are several ways of finding this information with ArcMap:

PDF resources found in your ArcMap installation:

C:\Program Files (x86)\ArcGIS\Desktop10.2\Documentation\projected_coordinate_systems.pdf

C:\Program Files (x86)\ArcGIS\Desktop10.2\Documentation\geographic_transformations.pdf

C:\Program Files (x86)\ArcGIS\Desktop10.2\Documentation\geographic_coordinate_systems.pdf

Using the OGP EPSG Area Polygons:

OGP's EPSG Area Polygons as Searchable Layers which is available to download from here @exprodat

blog_epsg_areapoly_image1.jpg
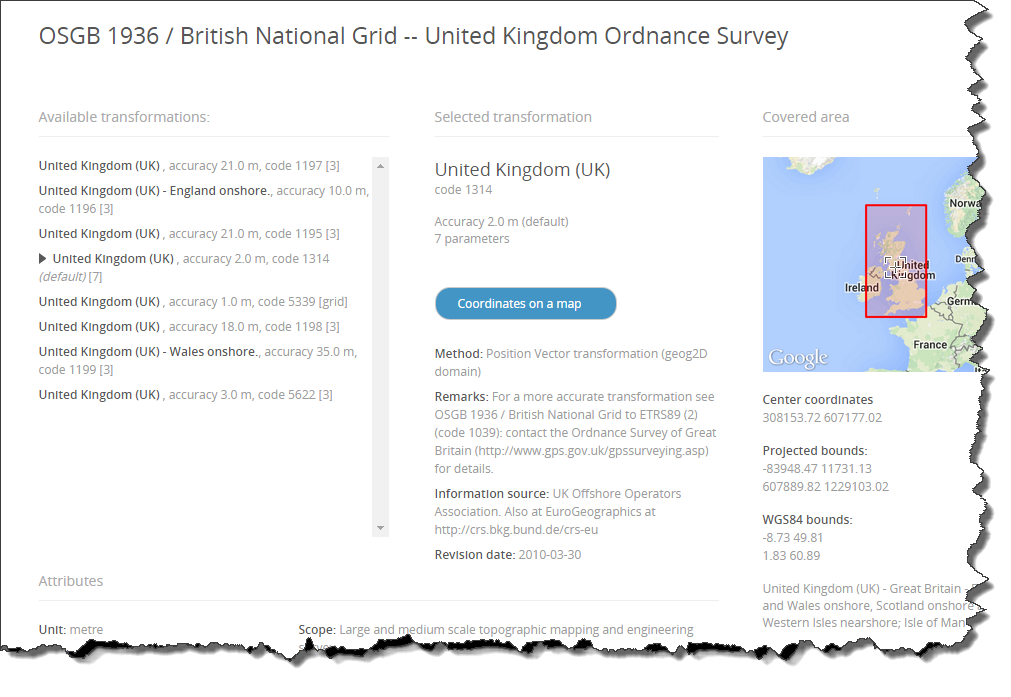
Using the ListTransformation and SpatialReference Object

The spatial reference object allows you to interrogate a layer, features class, shapefile, raster or a coordinate reference name to view or manipulate a spatial object's properties. These include spheroidName, datumName, projectionName, scaleFactor and many more.

In the below example the code interrogates the names of two projections systems, prints their spheroid name, geodetic datum and a list of transformations that are valid between the two projection systems within the specified extent.

# Define from and to Spatial Reference names
fromSpatRef = arcpy.SpatialReference('European Datum 1950 UTM Zone 31N')
toSpatRef = arcpy.SpatialReference('WGS 1984 UTM Zone 31N')

# Print the spheroid name for fromSpatRef and toSpatRef
print("from SpatRef spheroid: " + fromSpatRef.GCS.spheroidName)
print("to SpatRef spheroid: " + toSpatRef.GCS.spheroidName)

# Print the datum name for for fromSpatRef and toSpatRef
print("from SpatRef datum: " + fromSpatRef.GCS.datumName)
print("to SpatRef datum: " + toSpatRef.GCS.datumName)

# Extent for Central North Sea (values can be found in the data frame)
extent = arcpy.Extent(533553, 6469886, 993268, 6179505)

# list transformations valid for Central North Sea region
outlist = arcpy.ListTransformations(fromSpatRef , toSpatRef, extent)
print str(outlist)
       

This prints the following information:

from SpatRef spheroid: International_1924

to SpatRef spheroid: WGS_1984

from SpatRef datum: D_European_1950

to SpatRef datum: D_WGS_1984

[u'ED_1950_To_WGS_1984_1', u'ED_1950_To_WGS_1984_NGA_7PAR', u'ED_1950_To_WGS_1984_18', u'ED_1950_To_WGS_1984_2', u'ED_1950_To_WGS_1984_24', u'ED_1950_To_WGS_1984_25', u'ED_1950_To_ETRS_1989_4 + ETRS_1989_To_WGS_1984', u'ED_1950_To_WGS_1984_7', u'ED_1950_To_WGS_1984_36', u'ED_1950_To_WGS_1984_32_incorrect_DS', u'ED_1950_To_WGS_1984_32']


The ListTransformations function provides access to the list of transformations for a given area between any projection systems.

With this information it is possible to see a cut down list of what transformations are appropriate between any two CRS for a given area and investigate which of these is the appropriate method.

Further to this the syntax for a transformation method can be easily copy and pasted into other tools such as the Project Tool‌ and can be used within a script such as the below.

# Set variables XY values can be presented as a list
x = 309905
y = 6320846
srIn = 'European Datum 1950 UTM Zone 31N'
srOut = 'WGS 1984 UTM Zone 31N'
Transform = 'ED_1950_To_WGS_1984_18'

# Create point geometry from xy variables and project to   srOut with Tranform method
pointGeometry = arcpy.PointGeometry(arcpy.Point(x,y),srIn,False, False)
projectedPoint = pointGeometry.projectAs(srOut, Transform)

# Copy the reprojected points to a shapefile
arcpy.CopyFeatures_management(projectedPoint,r"C:\Users\Documents\ArcGIS\Wells.shp")
      

more
1 0 2,914
SimonKettle
Regular Contributor

What are Geodesic distances?

A geodesic line is the shortest path between two points on a curved surface, like the Earth. They are the analogue of a straight line on a plane surface or whose sectioning plane at all points along the line remains normal to the surface. It is a way of showing distance on an ellipsoid whilst that distance is being projected onto a flat surface.

However there are several types of lines that have different definitions which are listed at the bottom of this blog.

Here's a video example of a geodesic line, the longest geodesic line possible without touching land.

The below image shows a planar distance in orange and the geodesic distance of that planar distance in blue. The maximum deviation of the geodesic from the planar line is near 2,000 Km and the difference in length is 644 Km.

What this image represents is the actual path taken (geodesic line) if I travel in a straight line, relative to me with no turns, from London to Singapore along the International 1924 ellipsoid (this is what I displayed the map in ArcGIS in EPSG:4022).GeodesicCurve.jpg

This type of measurement forms part of a series of geodetic features whose measurements account for the distortion of projected space. The distortion of a sphere into 2D space is nicely visualized in the video below:

Jarke J. van Wijk | Mathematical Art Galleries

Why is this important?

Apart from what can be very large differences between geodetic and planar measurements, see the above example, in the real world these differences can have a legal consequence such as those seen in constructing license areas for oil and gas exploration and production, international boundaries and exclusive economic zones.

An example of geodesic line constructions having a political role is seen in the Beaufort Sea International Border dispute between Canada (Canadian Yukon) and The United States (Alaska). The maritime boundary between the two countries has been defined differently. Canada claims the boundary to be along the 141st meridian west out to a distance of 200 nautical miles, following the Alaska-Yukon land border (this is derived from the 1825 boundary treaty between Great Britain and Russia). The United States on the other hand define the boundary line as stretching out to 200 nautical miles perpendicular to the coast whilst being equidistant from the coast.

BeaufortSea.jpg

Red line is the Canadian boundary, Blue line the USA boundary and the stippled area is claimed by both parties.

Building Geodetic distances in ArcGIS

The features you draw in a normal ArcMap edit session are not geodetic (they are planar) unless you create them using either the Advanced Editor Construct Geodetic tool or one of the following geoprocessing tools: Bearing Distance To Line, Table To Ellipse, or XY To Line. Geodetic features do not account for changes in terrain, this is a topic for another blog.

The Construct Geodetic tool is found in the "Advanced Editing" toolbar.

AdvancedEditor.jpg
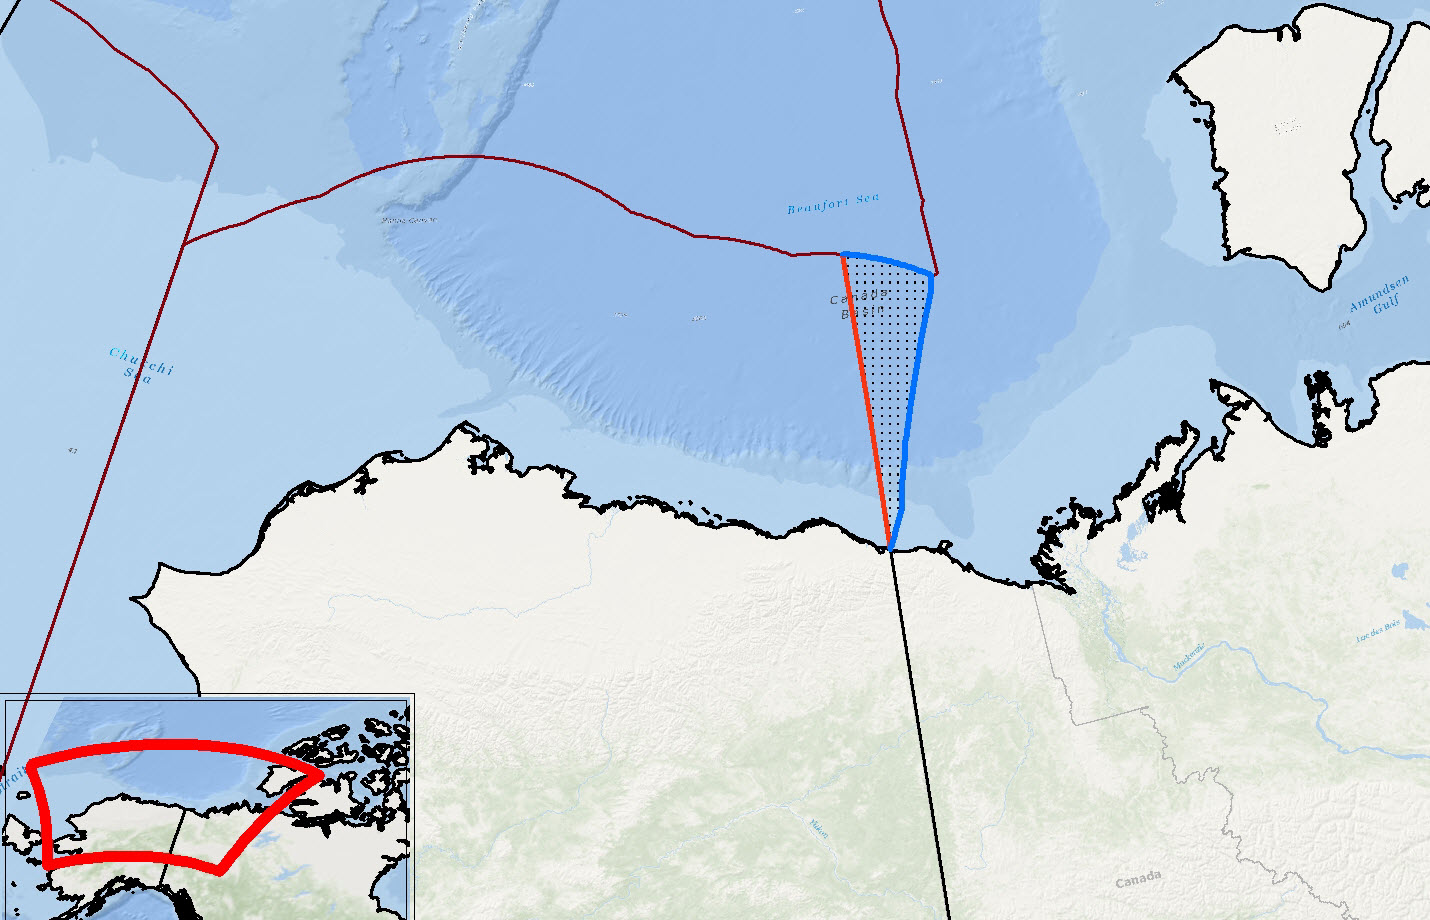
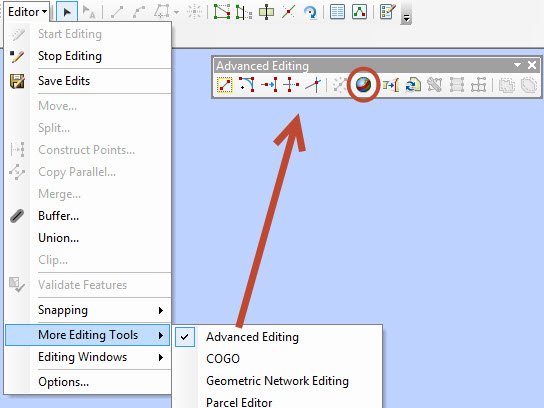
Here I shall make the Canadian border line which is defined as 200 nautical miles offshore along the Canadian-US border following the 141st Meridian Line.

  • First I specify the line type (note the other types defined below)
  • Use the snapping tool to add my start vertex to the end of the border
  • Change the segment type to Distance - Direction and specify the distance covered (changing it to Nautical Miles)
  • Specify the direction of the line

CanadianLineConstruct.jpg
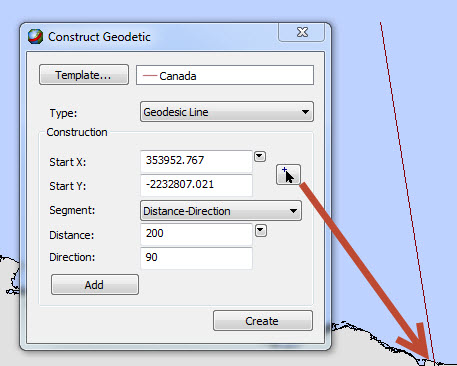
Now the line is constructed according to the chosen ellipsoid and is saved as a new feature upon saving edits.
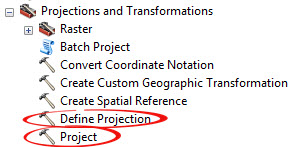
Some terms used in ArcGIS:

Taken from About geodetic features

  • Geodesic line—The shortest line between any two points on the Earth's surface on a spheroid (ellipsoid). One sample use for a geodesic line is when you want to determine the shortest distance between two cities for an airplane's flight path. Another example is the creation of the path between the point of impact and the point of origin of a missile. This is also known as a great circle line if based on a sphere, rather than an ellipsoid. The geodesic line type allows you to create lines only. In addition, you can create a multi-segment line which is a series of geodesic lines that make up a single line feature. You can use a multi-segment line when you want to create an airplane's flight path with waypoints, such as an air route with multiple stops that make up a full route.
  • Geodesic circle—A shape whose edge is defined as a particular geodetic distance from a fixed point. Depending on the coordinate system in which it is displayed, it may not appear to be a circle. You might use this if you are creating a range ring of a weapon system, such as to show a weapon's effective range. Geodesic circles can be used to create either lines or polygons.
  • Geodesic ellipse—A shape whose sum of geodetic distances from a fixed pair of points is a constant. You could use this to create a signal error ellipse. This is also known as a geodesic circle when the major and minor axes are the same length. The geodesic ellipse type allows you to create lines or polygons.
  • Great elliptic—The line on a spheroid (ellipsoid) defined by the intersection at the surface by a plane that passes through the center of the spheroid and the start and end points of a segment. This is also known as a great circle when a sphere is used. The great elliptic type allows you to create lines only.
  • Loxodrome—A loxodrome is not the shortest distance between two points, but instead defines the line of constant bearing, or azimuth. Great circle routes are often broken into a series of loxodromes, which simplifies navigation. This is also known as a rhumb line. The loxodrome type allows you to create lines only.
  •   
  

Something extra to try:

A cool app to see the effect of the project on a straightline:

Shortest Distance on Earth

Courtesy of The Magiscian | DIY maps, geoapps, discoveries … and magic in geography

more
8 5 45.4K
SimonKettle
Regular Contributor

There are two tools in ArcGIS Desktop associated with using coordinate reference systems that often cause confusion. I believe these confusions are mainly sourced from the semantics surrounding projections and the tools in question.

The tools are the Define Projection and Project tools.

CRS_Tools.jpg

In a nut shell...

Define Projection: This tool overwrites the coordinate system information in a dataset

This means only use the Define Projection tool on a dataset that has no coordinate system applied or to a dataset you know for certain has the wrong projection.

Project: This tool projects a dataset from one coordinate system to another through transformation or conversion

Use the Project tool when you want to convert a dataset from one coordinate system to another. For example when converting from ED_50_UTM_31N to ED_50_UTM_30N or when transforming between ED_50_UTM_31N and WGS84_UTM_31N

For more information check out these resources...

Exprodat Blog !@

ArcGIS Help

Support Services Blog

GIS Geek

Have a look at a related course to learn more on managing and working with coordinate reference systems with ArcGIS:

ArcGIS Coordinate Reference Systems for Petroleum | CRS Spatial Reference Petroleum Oil Gas Industry...

more
2 1 2,116
SimonKettle
Regular Contributor

What is a Vertical Datum?

The Geodetic Glossary (2009) defines height as ‘distance, measured along a perpendicular, between a point and a reference surface’. This definition is concise and direct but leaves a vagueness concerning the reference surface. This reference surface is the Vertical Datum. A datum is required to reach accurate and reliable measures of height above a surface.

The EPSG dataset currently lists 128 vertical datums worldwide. There are various types of height including:

  • Ellipsoidal (The difference between the topographic elevation and the ellipsoid)
  • Orthometric (The difference between the topographic elevation and the geoid)
  • Geoid (The difference between the ellipsoidal height and the geoid surface Note this can be negative)

Heights are categorized into two types, those with reference to the Earth's gravity field and those defined on geometry alone. It is important to note that the two categories of height are not directly interchangeable as they are completely different. Where the gravity field heights are based on the geoid that is defined by a eqipotential surface‌ compared to, for example, the height of a tree using right angle geometry where ground level is defined as 0 height.

DifferenceInHeights.png

Figure 1 Difference between the Geoid and Spheroid/Ellipsoid based surfaces and real topography (adapted from ESRI 2012) where h = Ellipsoidal height, N = Orthomatric height and H = Geoid height.

In my experience height is colloquially referred to as X units above or below Mean Seal Level (MSL). Sea level comes from the Earth' gravity field, therefore gravity is studied to understand height.

So, what is mean sea level?

In its simplest form MSL is the average location for the surface of the ocean measured over time to minimise random and periodic variation, such as tides and storm surges. The period of time to measure these variations in the ocean surface was set at 19 years by the U.S. National Ocean Surface, these measurements can be brought together to form a tidal datum.

However in this form MSL is not adequate as a global vertical datum as this mean calculation only exists at the station of measurement and its immediate vicinity, plus the ocean has a dynamic topography that is nicely summarised in this MinutePhysics video.

What is Sea Level? - YouTube

Why is a Vertical Datum important?

I work in the Oil and Gas industry and the application of a correct vertical datum is important in exploration, when defining a height or depth to a geological surface, and also when designing and implementing infrastructure projects such as pipelines, ports and other coastal infrastructure as well as when considering the environmental impacts that spills and other developments may have on coastlines and rivers. For example misunderstanding the vertical datum can impact planning for a storm surge that may have been measured on a different surface when compared to the height of a constructed LNG plant.

In essence there are 2 types of datums used in Vertical Coordinate Reference Systems:

Geoid-based versus Spheroid/Ellipsoid-based

The Geoid is a reference surface of the Earth and is based on the relationship between gravitational force and gravitational potential that produces a surface where all points are perpendicular to the force of gravity. Meyer (2010) provides an extensive review on the Geoid and the physics behind its construction. This surface is considered the proper surface to create geodetic heights and will nominally correspond to mean sea-level (see the previous video).

Recently there has been a move to see if data from the Gravity field and steady-state Ocean Circulation Explorer (GOCE) ESA project is able to be used with calculating heights and connecting height systems (see here). This will create a very high resolution Geoid for calculating heights across the globe.

Some examples of Geoid surfaces include:

  • EGM2008 Geoid
  • EGM84 Geoid
  • EGM96 Geoid

Spheroid/Ellipsoid-based surfaces use geometric calculations to define  the local datum and a spheroid.

It is important to note that it is impossible to transform between the geoid and Spheroid/Ellipsoid-based datums. This is because there are no common elements between the two reference systems and  no site-specific gravity measurements in a spheroid/ellipsoid system so no mathematical transformation can be applied.

Some examples of Spheroidal/Ellipsoid-based surfaces found in ArcGIS 10.2 include:

  • D_Cyprus_Geodetic_Reference_System_1993
  • D_Kuwait_Oil_Company
  • D_St_Lucia_1955

ArcGIS_VD.png

Figure 2 Example of the difference parts that make up a Vertical Datum as presented in ArcGIS.

The Geoid has a more complex surface than a Spheroid/Ellipsoid-based surface where the Spheroid/Ellipsoid-based surface shows a constant rate between chosen parameters of calculation whilst the geoid is ‘bumpy’ indicating the changing gravity measurements that represent the ‘real’ topography of the Earth (Figure 3).

EGM96_Geoid.png

Figure 3 The EGM96 Geoid. Taken from Wikipedia.

How do you set a vertical coordinate system in ArcGIS

When creating a new feature class tick the “Coordinates include Z values” option. This will enable the 3D measure of the feature class (Figure 4).

Enabling_Z.png

Figure 4 New Feature Class: Select Z values to enable 3D use

Click ‘Next’ to select the Geographic/Projected Coordinate System you want to use and then select the Vertical Coordinate System you would like to use.

Selecting a Vertical Datum.png

Figure 5. Choose the correct vertical coordinate system for you area of interest. Note that local Vertical CRS have been calculated from locally derived measurements and that MSL (Depth) and MSL (Height) use the EGM96 Geoid.

Summary and How to transform between Vertical Coordinate Reference Systems in ArcGIS?

Geoid-based vertical coordinate reference systems are lightly connected to their geographic coordinate system (GCS) and therefore almost any Geoid-based vertical coordinate reference system may be used with any GCS since they include a vertical datum as part of their definition.

Spheroid/Ellipsoid-based coordinate reference system defines heights that are referenced to the spheroid of a geographic coordinate system. A geographic coordinate system’s spheroid may fall above or below the actual earth surface due to the mathematic parameters used in calculating the surface.

A Spheroid/Ellipsoid-based coordinate reference includes a datum, rather than a vertical datum definition and hence will follow those transformations used when switching between different GCS and PCS (Project Coordinate Reference Systems).

References

Meyer, T. H., 2010. Introduction to Geometrical and Physical Geodesy: Foundations of Geomatics. ESRI...

more
2 6 15.2K
SimonKettle
Regular Contributor

"It is vitally important to understand the difference between changing the coordinate reference system (CRS) property of a geographic dataset and converting the feature coordinates of a geographic dataset to a different CRS.  Confusing them can lead to incorrectly located data and potentially some gross errors in the position of the features in your geographic data."

Follow these links to some useful blog articles on how to manage CRS in ArcGIS courtesy of @exprodat

Tip 12: Coordinates and ArcGIS - Blogs -

Correctly Aligning Features in ArcMap: 1 - Blogs -

Correctly Aligning Features in ArcMap: 2 - Blogs -

Correctly Aligning Features in ArcMap: 3 - Blogs -

CRS.jpg

more
2 0 1,474
SimonKettle
Regular Contributor

The International Association of Oil and Gas Producers (OGP) released EPSG Area Polygons in 2012 as a freely available spatial dataset that accurately defines the applicable extent of the CRSs and transformations in the EPSG Geodetic Parameter Dataset (EPSG Dataset). 

Check out the @Exprodat Blog on using OGP's EPSG Area Polygons

blog_epsg_areapoly_image1.jpg

Download the OGP's EPSG Area Polygons as Searchable Layers

http://www.arcgis.com/home/item.html?id=2ff6d44a19854280aec1d56368e12605

more
1 0 1,761
32 Subscribers