Coordinate Reference Systems Blog - Page 2

cancel
Showing results for 
Show  only  | Search instead for 
Did you mean: 

Latest Activity

(30 Posts)
SimonKettle
Occasional Contributor III

What does the "2000" mean at the end of the coordinate system names in the Solar System folder?

You can also find reference to the number in the details of the *.prj file itself.

GEOGCS["GCS_Jupiter_2000",DATUM["D_Jupiter_2000",
SPHEROID["Jupiter_2000_IAU_IAG",
71492000.0,15.41440275981026]],
PRIMEM["Reference_Meridian",0.0],
UNIT["Degree",0.0174532925199433]]

The number suffix is, in fact, a date. It refers to the currently used standard equinox (and epoch) which is J2000.0. 

The prefix "J" indicates that it is a Julian epoch and the number refers to January 1, 2000, 12:00 Terrestrial Time. There have been other standard equinoxes (and epoch) where the previous version was B1950.0, with the prefix "B" indicating it was a Besselian epoch. Julian equinoxes and epochs have been used for every equinox since 1984.

Why do we need to use a fixed date and time?

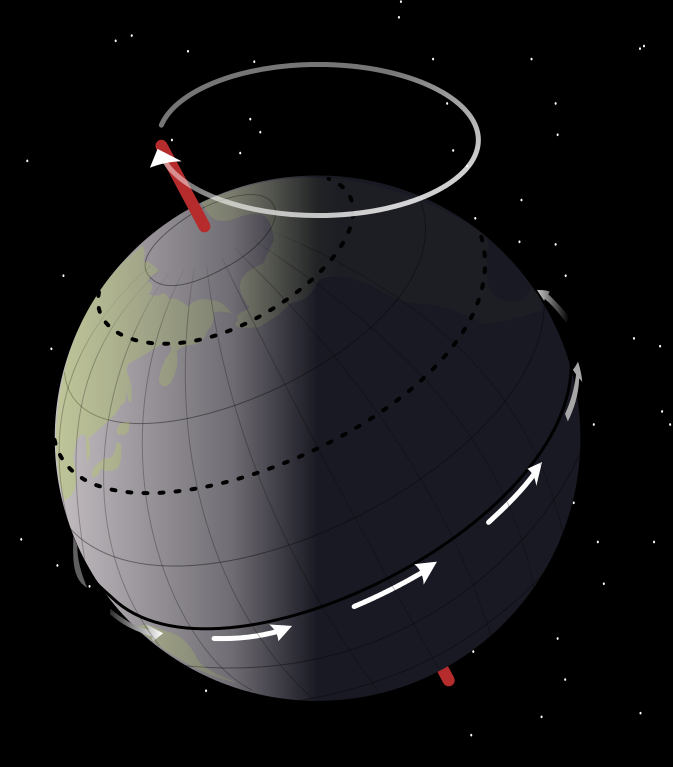
In a phrase, J2000 is needed due to the precession of the equinoxes.

Forming part of the Milankovitch theory of long term climate change the precession of the equinoxes refers to the observable phenomena of the rotation of the celestial sphere. A cycle which spans a period of (approximately) 25,920 years, over which time the constellations appear to slowly rotate around the earth, taking turns at rising behind the rising sun on the vernal equinox.

Precessional movement of Earth (right). Earth rotates (white arrows) once a day around its rotational axis (red); this axis itself rotates slowly (white circle), completing a rotation in approximately 26,000 years

Watch this video on Precession of the Earth

What are the effects of the Precession of Equinoxes on reference systems?

If the position of the celestial poles and equators are changing on the celestial sphere, then the celestial coordinates of objects, which are defined by the reference of the celestial equator and celestial poles, are also constantly changing and since the location of the equinox changes with time, coordinate systems that are defined by the vernal equinox must have a date associated with them.

This specified year is called the Equinox (not epoch). Currently, we use Equinox J2000.0

The main epochs in common use are:
– B1950.0 - the equinox and mean equator of 1949 Dec 31st 22:09 UT.
– J2000.0 - the equinox and mean equator of 2000 Jan 1st 12:00 UT 

The B1950 and J2000 reference frames are defined by the mean orientation of the Earth’s equator and ecliptic at the beginning of the years 1950 and 2000.

more
2 0 11.2K
SimonKettle
Occasional Contributor III

Planetary Coordinate Reference Systems

There is an interesting but perhaps little-used folder of *.prj files called “Solar System”. As someone interested in geodesy and its application it is particularly intriguing how scientists have constructed coordinate reference systems for planetary bodies other than the Earth.

First off let’s have a look at the details found in ArcGIS Desktop for "Geographic Coordinate Systems" of solar system objects. ArcGIS does not have any projected coordinate reference systems for the other planets and moons. Therefore you'll have to make a custom projection if you want to build upon the geographic coordinate system.

However, the folder contains coordinate reference systems for all the major objects found in the Solar System including all the planets, Jupiter's Moons and many others.

Let's start with the Moon

Apart from Earth, the Moon is arguably the astronomical body with the longest applied study of coordinate systems due to its long history of observation compared to other bodies. Interestingly, a standard Lunar Coordinate System was only agreed upon in 2006 for the Lunar Reconnaissance Orbiter mission and in 2008 a Lunar Geodesy and Cartography Working Group was created to maintain the current reference system.

Lunar coordinates, also known as Selenocentric coordinates, act in a similar way to those on Earth using the same nomenclature for geodetic longitude and latitude on Earth. As on Earth, latitude measures the distance north or south of an equator defined to be approximately 90° from the rotation axis, while longitude is measured east and west from an arbitrarily chosen central meridian.

On the Moon, the origin of the coordinate system passes through the point that is most nearly, on average, pointed towards the centre of the Earth. The "on average" part of the definition of the origin is because of precession, the change in the axis of rotation with respect to a reference plane.

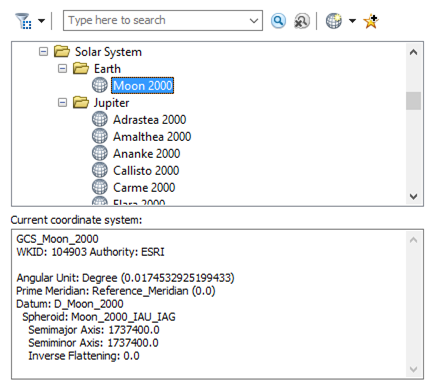
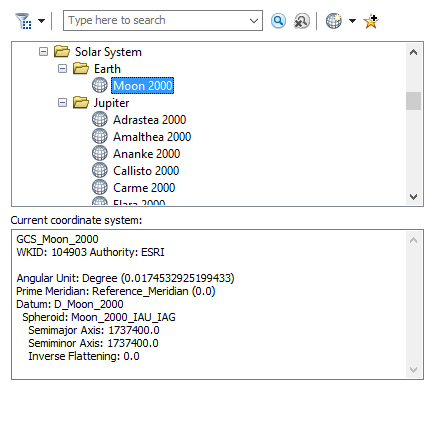
From the first image, it can be seen that the Moon is regarded as a perfect sphere (both semimajor and semiminor axis are the same value: 1737400.00 m). 

Before we explore further there are two definitions that are important to know when working with planetary bodies:

Planetocentric coordinates (for the Moon selenocentric) -  are expressed as coordinates with the origin at the center of mass of the body. The coordinates refer to the equatorial plane of the body concerned and are commonly used within calculations of celestial mechanics.

Planetographic coordinates (for the Moon selenographic) - are used for observations of the surface features of those planets whose figures are not truly spherical, but oblate. They are referred to the mean surface of the planet, and are the coordinates actually determined by observation.

The Moon uses selenocentric coordinates where Latitude is the angle between a line extending from the origin to the planetary equator and a vector to the point of interest. Longitude is the angle between this vector and the plane of the Prime Meridian measured in an eastern direction. Radius is the distance from the Moon’s center of mass to the point of interest. The radius of the Moon is defined as 1,737.4 km

Lunar Fixed Reference System

However, there are really two reference systems for the Moon and it has to do with the two definitions above. However, ArcGIS Desktop 10.3 only shows a selenocentric coordinate system. The principal difference between the following reference systems is how the Moon's axes are treated.

Mean Earth - Polar System a selenocentric system

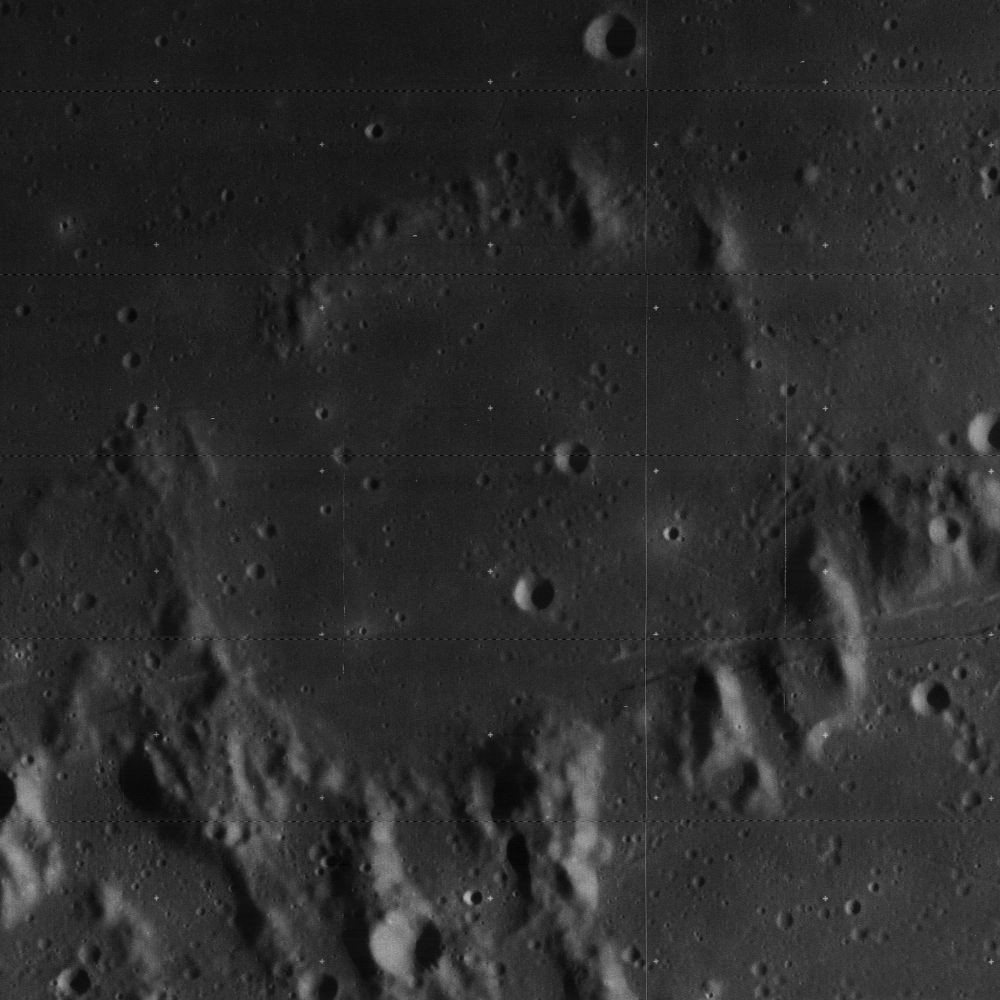
The Mean Earth/Polar Axis reference system defines the z-axis as the mean rotational pole. The Prime Meridian (0˚ Longitude) is defined by the "mean Earth direction" (the point on the lunar surface designated as the origin, this happens to be close to the Oppolzer A crater, below). This system is used in operations for planning, observational targeting, geographic identification of lunar landforms, and inter-mission communications. 

Principal Axis System a selenographic system

This system can be thought of as a body-fixed rotating coordinate system. The Moon principal axes are used but due to the Moon's rotating characteristics, tidally locked to the Earth, this system and the Mean Earth/Polar Axis System do not align. However, they can be aligned through a transformation method bringing the error down to approximately 1Km.  The Principal Axis System is used for studies including gravity field survey and lunar laser ranging.

Key information and positioning of the Moon can be explored further using HORIZONS by JPL.

Selenocentric details as found in ArcGIS

GEOGCS["GCS_Moon_2000",DATUM["D_Moon_2000",SPHEROID["Moon_2000_IAU_IAG",1737400.0,0.0]],
PRIMEM["Reference_Meridian",0.0],UNIT["Degree",0.0174532925199433]]

Lunar Reconnaissance Orbiter

Explore the mapping created by the Lunar Reconnaissance Orbiter Camera on the LROC WMS Image Map

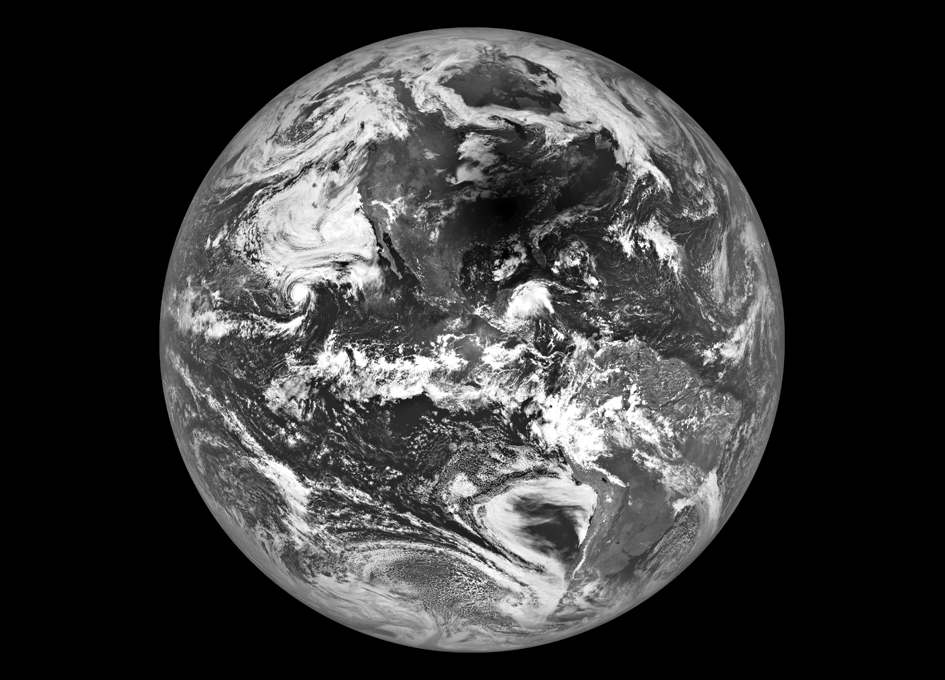
And here's a great image I could not resist posting which was taken by the Lunar Reconnaissance Orbiter Camera of the Solar Eclipse on 21st August 2017.

more
4 0 12.4K
SimonKettle
Occasional Contributor III

Vincenty's Formulae are two methods named after Thaddeus Vincenty a Polish-American geodesist who lived during the 20th Century. During his career, he devised his formulae as well as contributing to major projects such as the NAD 83 where he introduced three-dimensional Earth-centered coordinates. Vincenty's formulae were published in 1975 and it can be downloaded and read here.

The formulae were developed for calculating geodesic distances between a pair of lati­tude/longi­tude points on an ellipsoidal model of the Earth (an oblate sphere). This ellipsoidal geometry is the next step, and perhaps, more appropriate geometry to use when modeling the Earth from working with a sphere using the Haversine Formula see https://community.esri.com/groups/coordinate-reference-systems/blog/2017/10/05/haversine-formula?sr=.... Unlike the Haversine method for calculating distance on a sphere, these formulae are an iterative method and assume the Earth is an ellipsoid.

Sphere outline is dotted line. Solid outline ellipsoid (oblate sphere)

However, even though Vincenty's formulae are quoted as being accurate to within 0.5 mm distance or 0.000015″ of bearing; the Haversine formulas are accurate to approximately 0.3%, which maybe be good enough for your project. Further consideration should be given to the datum being used, for example, WGS-84 is defined to be accurate to ±1m, perhaps negating the 0.5mm distance accuracy quoted for these formulae!

Understanding underlying assumptions is important for accuracy.

The formulae published by Thaddeus Vincenty include a direct and an inverse method where:

  1. The Direct Method computes the location of a point that is a given distance and azimuth from another point
  2. The Inverse Method computes the geographical distance and azimuth between two given points. 

As mentioned above the formulae are iterative processes meaning that a sequence of equations is calculated where the output is reentered into the same sequence of equations. The aim is to minimise the output value after a set number of iterations.

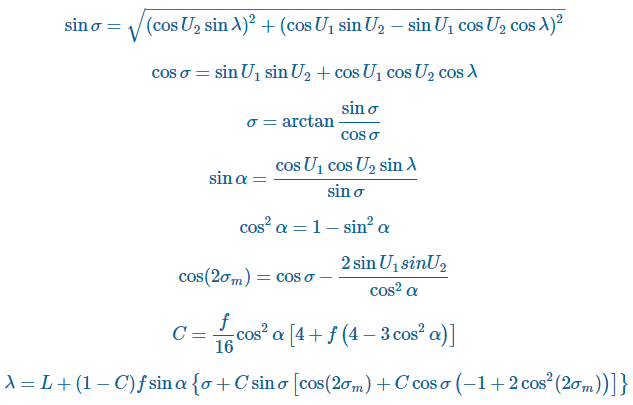
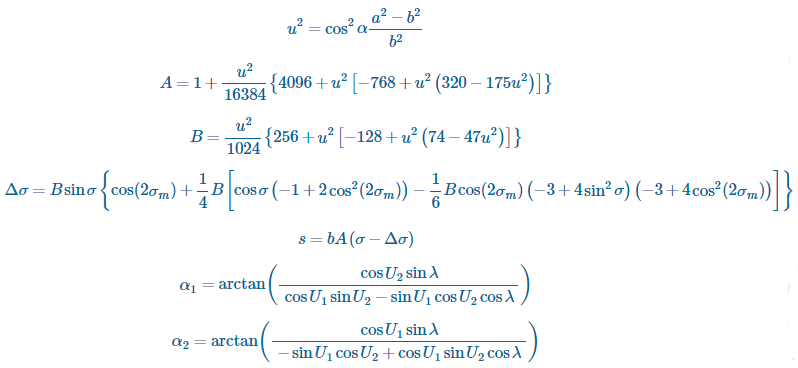
For example, the Inverse Method outputs λ after assigning several constants including the length of the semi-major axis, length of the semi-minor axis, flattening, latitude coordinates, reduced latitudes, etc. The aim of the method is to minimise the value of the output λ (i.e. when the results converge to a desired degree of accuracy):

When the difference between the current value of λ and the value of λ from the previous iteration is less than the convergence tolerance then the final stage of the Inverse Method can be executed:

It is worth noting that this iterative solution to the inverse problem fails to converge or converges slowly for nearly antipodal points. This issue was discussed and alternative methods proposed in future papers by Vincenty (e.g. Vincenty 1975b).

The code for these formulae is available in Python from the PyGeodesy GitHub project or from Nathanrooy.github.io. Using PyGeodesy, the user can implement the Vincenty methods and change the ellipsoid for example in the below (taken from PyGeodesy GitHub project):

#from pygeodesy.ellipsoidalVincenty import LatLon
Newport_RI = LatLon(41.49008, -71.312796)
Cleveland_OH = LatLon(41.499498, -81.695391)
Newport_RI.distanceTo(Cleveland_OH)
866455.4329158525 # meter

#Change the ellipsoid model used by the Vincenty formulae as follows:
from pygeodesy import Datums
from pygeodesy.ellipsoidalVincenty import LatLon
p = LatLon(0, 0, datum=Datums.OSGB36)
#or by converting to anothor datum:
p = p.convertDatum(Datums.OSGB36)‍‍‍‍‍‍‍‍‍‍‍‍‍‍‍‍‍‍‍‍‍‍‍‍‍‍‍‍‍‍‍‍‍‍‍‍‍‍‍‍‍‍‍‍‍‍‍‍‍‍‍‍‍‍‍‍‍‍‍‍‍‍‍‍‍‍‍‍‍‍‍‍‍‍‍‍‍‍‍‍‍‍‍‍

I would also recommend having a look at the code samples written by Dan Patterson‌ on his Github Numpy Samples page.

more
2 0 20.1K
SimonKettle
Occasional Contributor III

I decided to look into some of the mathematics that makes it possible to calculate distances considering 3D space, for example, calculating distance on a sphere. You can find our more on geodesic distances from the previous blog (https://community.esri.com/groups/coordinate-reference-systems/blog/2014/09/01/geodetic-distances-ho... ).

The Earth is round but big, so we can consider it flat for short distances. But, even though the circumference of the Earth is about 40,000 kilometers, flat-Earth formulas for calculating the distance between two points start showing noticeable errors when the distance is more than about 20 kilometers. Therefore, calculating distances on a sphere needs to consider spherical geometry, the study of shapes on the surface of a sphere. 

Spherical geometry considers spherical trigonometry which deals with relationships between trigonometric functions to calculate the sides and angles of spherical polygons. These spherical polygons are defined by a number of intersecting great circles on a sphere. Some rules found in spherical geometry include:

  • There are no parallel lines.
  • Straight lines are great circles, so any two lines meet in two points.
  • The angle between two lines is the angle between the planes of the corresponding great circles.

The Haversine

Did you know that there are more than the 3 trigonometric functions we are all familiar with sine, cosine and, tangent? These additional trigonometric functions are now obsolete, however, in the past, they were worth naming. 

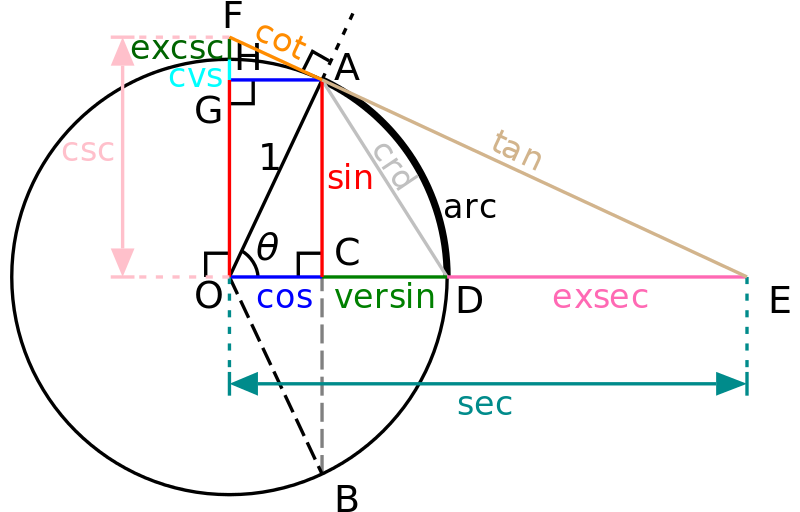
The additional trigonometric functions are versine, haversine, coversine, hacoversine, exsecant, and excosecant. All of these can be expressed simply in terms of the more familiar trigonometric functions. For example, haversine(θ) = sin²(θ/2).

The haversine formula is a very accurate way of computing distances between two points on the surface of a sphere using the latitude and longitude of the two points. The haversine formula is a re-formulation of the spherical law of cosines, but the formulation in terms of haversines is more useful for small angles and distances.

One of the primary applications of trigonometry was navigation, and certain commonly used navigational formulas are stated most simply in terms of these archaic function names. But you might ask, why not just simplify everything down to sines and cosines? The functions listed above were from a time without calculators, or efficient computer processors, when the user calculated angles and direction by hand using log tables, every named function took appreciable effort to evaluate. The point of these functions is if a table simply combines two common operations into one function, it probably made navigational calculations on a rocking ship more efficient.

These function names have a simple naming pattern and in this example, the "Ha" in "Haversine" stands for "half versed sine" where haversin(θ) = versin(θ)/2.

Haversine Formula 

The Haversine formula is perhaps the first equation to consider when understanding how to calculate distances on a sphere. The word "Haversine" comes from the function:

haversine(θ) = sin²(θ/2)

The following equation where φ is latitude, λ is longitude, R is earth’s radius (mean radius = 6,371km) is how we translate the above formula to include latitude and longitude coordinates. Note that angles need to be in radians to pass to trig functions:

a = sin²(φB - φA/2) + cos φA * cos φB * sin²(λB - λA/2)
c = 2 * atan2( √a, √(1−a) )
d = R ⋅ c

We can write this formula into a Python script where the input parameters are a pair of coordinates as two lists:

'''
Calculate distance using the Haversine Formula
'''

def haversine(coord1: object, coord2: object):
    import math

    # Coordinates in decimal degrees (e.g. 2.89078, 12.79797)
    lon1, lat1 = coord1
    lon2, lat2 = coord2

    R = 6371000  # radius of Earth in meters
    phi_1 = math.radians(lat1)
    phi_2 = math.radians(lat2)

    delta_phi = math.radians(lat2 - lat1)
    delta_lambda = math.radians(lon2 - lon1)

    a = math.sin(delta_phi / 2.0) ** 2 + math.cos(phi_1) * math.cos(phi_2) * math.sin(delta_lambda / 2.0) ** 2
    
    c = 2 * math.atan2(math.sqrt(a), math.sqrt(1 - a))

    meters = R *# output distance in meters
    km = meters / 1000.0  # output distance in kilometers

    meters = round(meters, 3)
    km = round(km, 3)


    print(f"Distance: {meters} m")
    print(f"Distance: {km} km")‍‍‍‍‍‍‍‍‍‍‍‍‍‍‍‍‍‍‍‍‍‍‍‍‍‍‍‍‍‍‍‍‍‍‍‍‍‍‍‍‍‍‍‍‍‍‍‍‍‍‍‍‍‍‍‍‍‍‍‍‍‍‍‍‍‍‍‍‍‍‍‍‍‍‍‍‍‍‍‍‍‍‍‍‍‍‍‍‍‍‍‍‍‍‍‍‍‍‍‍‍‍‍‍‍‍‍‍‍‍‍‍‍‍‍‍‍‍‍‍‍‍‍‍‍‍‍‍‍‍‍‍‍‍‍‍‍‍‍‍‍‍‍‍‍‍‍‍‍‍‍‍‍‍‍‍‍‍‍‍‍‍‍‍‍‍‍‍‍‍‍‍‍‍‍‍‍‍‍‍‍‍‍‍‍‍‍‍‍‍‍‍‍‍‍‍‍‍‍‍‍‍‍‍‍‍‍‍‍‍‍‍‍‍‍‍‍‍‍‍‍‍‍‍‍‍‍‍‍‍‍‍‍‍‍‍‍‍‍‍‍‍‍‍‍‍‍‍‍‍‍‍‍‍‍‍‍‍‍‍‍‍‍‍‍‍‍‍‍‍‍‍‍‍‍‍‍‍‍‍

The result will print as below:

haversine([-0.116773, 51.510357], [-77.009003, 38.889931])

Distance: 5897658.289 m
Distance: 5897.658 km‍‍‍‍‍‍‍‍‍‍‍‍‍‍‍‍‍‍‍‍‍‍‍‍‍‍‍‍

more
6 1 163K
SimonKettle
Occasional Contributor III

Introduction

The Global Geodetic Reference Frame (GGRF) is the realisation of the Global Geodetic Reference System (GGRS). The GGRS comprises terrestrial and celestial components allowing users to precisely determine and express locations on the Earth, as well as to quantify changes of the Earth system in space and time. 

What is the GGRF?

GGRF has been developed to support the increasing demand for positioning, navigation, timing, mapping, and geoscience applications. It is an essential development for a reliable determination of monitoring changes in the Earth system, natural disaster management, sea-level rise and climate change amongst many other things. The GGRF has also come about due to globalization and the need for universal interoperability requirements across geospatial technologies. 

The economic benefit of implementing the Global Geodetic Reference Frame is significant and it will play a big role in underpinning the UN's Sustainable Development Agenda.

GGRF Theory

At present, the GGRF is realized through the International Terrestrial Reference Frame (ITRF), International Celestial Reference Frame (ICRF) and physical height systems including the future International Height Reference Frame (IHRF), and the new global absolute gravity network (IGSNn). In other words an integrated global geodetic reference frame.

The infrastructure for the realisation of the GGRF has been published by the Global Geodetic Observing System (GGOS) a part of the International Association of Geodesy and includes the integration of multiple geodetic observation bases. GGOS has defined the GGRF to include many layers of observation including terrestrial networks with geometric and gravimetric observation stations, artificial satellites, the moon and the planets, and extragalactic objects". These infrastructures include the geometry and gravity field of the Earth and the Earth's orientation with respect to the celestial reference frame. 

The geodetic observation infrastructures providing the bases for the determination and maintenance of the Global Geodetic Reference Frame (GGRF). Image taken from https://iag.dgfi.tum.de/fileadmin/IAG-docs/GGRF_description_by_the_IAG_V2.pdf

Implementation

The GGRF is an integrated geodetic reference frame, meaning the combination of many reference frames, terrestrial, celestial, height and gravity networks. With the large amount of collaboration and integration needed to reach a GGRF the UN published a resolution on a Global Geodetic Reference Frame for Sustainable Development.

This resolution calls for the international community to encourage and work together, through international organisations including the IAG, to build a global community opening sharing geodetic data, standards and governance as well as providing technical assistance and development in geodesy across developing countries. 

I think that is something we can all get behind and hope to see develop in the coming years!

References

UNGGRF.org  

Global Geodetic Reference Frame (GGRF) 

Description of the Global Geodetic Reference Frame

more
1 1 2,440
MelitaKennedy
Esri Notable Contributor

A customer had some questions on why Esri has "null" or "bookkeeping" transformations as well as why there are transformations which have the same parameter values, but convert between multiple geographic coordinate systems. Here's what I wrote off the top of my head.


  • WGS84 is actually not accessible to normal consumers because it’s a military system. Yes, GPS reports WGS84, but in a degraded state. RTK/post-processing are actually linking to ITRFxx or local GCS/datum like NAD83 (2011).
  • A lot of data is labeled NAD83 but is really another realization like NAD83 HARN or CORS96 or worse, a mix of several realizations as the dataset has been edited over the years.
  • Similarly, there’s tons of data that’s labeled WGS84 that really isn’t.
  • Some states had one HARN realization, other had 2 or 3. NGS only published conversions between NAD83 (1986) and the first HARN realization, not the later ones.
  • Transformations didn’t exist between HARN, NSRS2007, and 2011 until a few years ago. We’ve put in transformations for GEOCON and GEOCON11 v1.0. There’s a new NGS version in beta that further differentiates between the various HARN realizations, by calling later ones FBN.
  • The NGS CORS website has published some 14 parameter transformations (time-based coordinate frame which has 3 translations, 3 rotations, plus a scale difference plus 7 more parameters that have time components) between ITRFxx or IGSxx (basically equivalent) to NAD83 (realization). Esri has incorporated these as 7 parameter coordinate frames by dropping the time components. That means the transformations occur at the ‘reference epoch.’
  • Knowing there’s a mish-mash of data out there, I’ve put equivalents where I duplicate an ITRF-to-NAD83 with WGS84-to-NAD83 versions. I’ve also added null or “bookkeeping” transformations (where the parameters are zeroes) to get between GeoCRS (geographic coordinate reference systems) where there’s no other transformation or at a certain accuracy level, these can be considered equal.
  • I have not been consistent about it, and have been putting in fewer as time goes on and I learn more about geodesy and as the accuracy has been improving on the more recent realizations.
  • EPSG (http://www.epsg.org and http://www.epsg-registry.org) plan to put in the multiple realizations of WGS84 and Canada’s NAD83 CSRS shortly. We’ll follow, probably for 10.5.1. That’ll make everything even more confusing!

more
4 1 1,111
MelitaKennedy
Esri Notable Contributor

While fine-tuning a technical workshop for next week, my co-presenter and I realized that our comment of "don't forget these knowledge base articles!" (see terminology note below) wasn't very helpful. You used to be able to go to http://support.esri.com and type in a knowledge base/technical article number like 23025. That would bring up "FAQ: Projection Basics: What the GIS Professional needs to know."

The Support website has been redesigned and that trick no longer works. Below I've included the new links to some of the useful coordinate systems, map projections, and geographic (datum) transformations technical articles.

23025: http://support.esri.com/technical-article/000005562, FAQ: Projection Basics: What the GIS professional needs to know

17420: http://support.esri.com/technical-article/000002813, FAQ: Where can more information be found about coordinate systems, map
projections, and datums?

29129: http://support.esri.com/technical-article/000007880, How To: Identify the
spatial reference, projection, or coordinate system of data

21327: http://support.esri.com/technical-article/000004829, How To: Select the correct geographic (datum) transformation when
projecting between datums

24893: http://support.esri.com/technical-article/000006217, How To: Identify an unknown projected coordinate system using ArcMap

29035: http://support.esri.com/technical-article/000007831,
How To: Define the projection for CAD data for use in ArcMap

If you have a favorite KB/technical article number, you can also append the number to this partial link:

http://support.esri.com/en/knowledgebase/techarticles/detail/

which will automatically redirect to the new URL.

Terminology note: Originally, they were called knowledge base articles and sometimes referred to as KB articles. A few years ago, the name was changed to technical articles.

more
2 8 3,161
SimonKettle
Occasional Contributor III

The Central European Net (CEN )

The European datum began its life as the Central European First-Order Triangulation Adjustment (Hough, 1947) this project began in April 1945 after the U.S Third Army with the HOUGHTEAM captured the trigonometrical section of the Reichsamt für Landesaufnahme in the town of Friedrichsroda, Thuringia (after the raid in Saalfeld - part 2). This group were taken to Bamberg, in the United States Occupation Zone, for interrogation.

It was discovered that the captured Germans, led by Professor Erwin Gigas, had been completing an adjustment of the first-order triangulation of the Greater Reich with the intent to expand this adjustment across the German occupied territories...

“…the material of observation for the triangulation of Central Europe available at the end of the war was almost entirely based on new observations. Thus it appeared advisable to readjust this new material, introducing all astronomical data and the base lines remeasured in the meantime. This task was assigned to the Central Survey Office -- now known as the Land Survey Office -- an organization founded in Bamberg by the U S. Army.” Hough 1948

The assigned Land Survey Office (operating under the Army Map Service and U.S Coast and Geodetic Survey) based in Bamberg commenced the adjustment of the first-order triangulation in June 1945 (Whitton, 1952). It was here, overlooked by the US Army and led by Erwin Gigas, that the German trigonometrical section started a review of all points previously calculated highlighting those of sufficient reliability to be used in the first-order triangulation…

…by adopting the area of the whole of North Western Germany unchanged [,] use of the numerous astronomic observations was rendered impossible. Therefore, the so arising final German Reiehsdreieeksnetz, though constituting a sufficient basis for Germany herself, was no adequate nucleus for any Central European or even European Network…” Hough 1948

This review of German triangulation points created a list of data points that were originally used as area controls rather than individual arcs.  Selecting from the list of first-order points arcs were chosen and thus the framework for the triangulation adjustment was constructed. The captured Germans at Bamberg performed a least-squares adjustment of Western Europe utilising the HOUGHTEAM’s captured data (see list at the end of this blog). The work plan for the adjustment is laid out as 10 points in Hough, 1947.

The adjustment was conducted using methods like the Bowie Junction method (Adams and Oscar, 1930)  which was previously incorporated into the successful adjustment of the North American Datum 1927 (EPSG: 6267). Work was designed to follow a network of arcs following as much as possible meridians and parallels from the existing triangulation.

Bowie method is an arc method of adjusting a triangulation network, where length and azimuth of one side of a triangle at every junction between arcs (chains) are assumed correct and carried into a suitable figure of the junction. Directions or angles in arcs between these figures are then calculated, the corrections in the individual chains calculated, and the misclosures passed into the longitudes and latitudes of the initially fixed sides in the junctions by an adjustment of the entire network, using the method of least squares.

Locational calculations were incorporated from over 140 years of German records choosing the most logical values for astronomic and angle observations, bases and Laplace azimuths. This incorporation ultimately resulted in the Deutsches Hauptdreiecksnetz (EPSG: 6314).

The HOUGHTEAM was disbanded in September 1945 after completing a hugely successful operation for the war effort. During its 11-month mission the collection can be summarised as:

  • Obtained complete geodetic data coverage of four provinces of Germany, discovered in the combat area, delivered direct to the artillery and put into an immediate operational use at the front.
  • Selected captured enemy material shipped to Army Map Service:
    • 202 boxes of geodetic data on 900,000 stations in Europe, giving nearly complete coverage of first, second, third, and fourth control in all German and Allied operational World War II areas of the continent
    • 627 boxes of captured maps, covering approximately the same areas noted above (a)
    • Large quantities of photograph prints and dispositives for portions of above areas
    • 371 boxes of various surveying and photogrammetric instruments, including seven Zeiss stereoplanigraphs
    • Geodetic and cartographic library reference books on all countries in Europe.
  • Acquisition of a nucleus of German geodesists and mathematicians and their removal to the United States Area of Occupation for use on scientific projects by U.S. forces.
  • Technical supervision of the adjustment of European first-order triangulation to a common geodetic datum, ED50.
  • The compilation of the magnetic atlas of Europe, epoch 1944-45, published in 1950 by the Army Map Service.

List taken from http://disturbedgeographer.com/?p=199

Whilst German triangulation and locational work was carrying on, the First International Geodetic Conference on the Adjustment of European Triangulation was held on August 7th 1946 in Paris (Hough, 1948). Here it was discussed and the decision made to examine the triangulation adjustment problem of Europe, as a whole, based on joining work currently being carried out on the Central European Adjustment with the ultimate aim of creating a common European Datum.

Due to the suffering under occupation of most European nations by the Germans contempt lay at the decision to have them involved in the project. As an alternative the United States chose the engineering task to be carried out by the Army Map Service for the first phase of the European-wide adjustment. Each nation taking part reported their…

“observed directions prepared from its latest first-order triangulation observations, its bases, Laplace azimuth, astronomic latitude and longitude observations, descriptions of stations, together with a technical report on the data with recommendations as to its use in the adjustment and relative weights to be accorded” (Hough, 1948)

…in total some 1500 first-order stations were contained in the triangulation adjustment.

The Central European First-Order Triangulation Adjustment was completed in June 1947.

The triangulation arcs can be visualized in Hough, F. W. (1947), The readjustment of European triangulation, Eos Trans. AGU, 28(1), 6266, doi:10.1029/TR028i001p00062.

Expanding the net to create a European Datum

Other blocks were intended for connection to the Central European Net, these included a North-European Net, South-West European Net (Whitten, 1952), South East European Net and East European Net (Weber, 2000). The incorporation of these new blocks into the CEN required large amounts of calculations and processing, a primary place to introduce the use of computers. Charles Whitten, the Chief Geodesist at NOAA, and advocate of using computers to process geodetic computations passed on his methods to incorporate the blocks into a single triangulation network created the European Datum.

International cooperation

The readjustment of the Western European Bloc was completed on June 30th, 1950 along with the combination of additional “blocks” of retriangulation which resulted in the European Datum 1950 (Hough, 1951). This is one of the first examples of true international cooperation, a project that was born out of the combination of national jealousies and war but resulted in a continent-wide standard in cartography, positional science and the study of the shape of the Earth.

Fittingly Floyd Hough wrote appropriate words on the creation of the European datum placing it as one of the major projects of cooperation in European and world history born out of the contrasting chaos of war.

“The term ‘cooperation’ is one of the most satisfying and comprehensive words in the English language. If we were to have complete cooperation in all matters between individuals and nations, the acme of human aspiration would be reached; selfishness would be abandoned; universal peace would be a fact; the millennium would be at hand.” Hough, (1951)

The triangulation was tied to the International Ellipsoid 1924 (Hough, 1948) built upon some 173 astronomic latitudes, 126 astronomic longitudes and 152 azimuths (Barsky, 1971), no one station can be designated as the datum origin rather a fundamental point is designated at the Helmert Tower in Potsdam, Germany (52°22’51.45”n Latitude 13°03’58.74”e longitude). The design of the first-order triangulation network was designed so that any further triangulation and positional calculations were made using this rigid base, as Hough (1948) described:

“Interior triangulation of the area can be adjusted at will to this rigid framework much as the inner portion of a modern steel building is fitted to its network of beams and columns.…” Hough 1948

This was the story about how the European Datum of 1950 was created and has formed the basis of a standard positional framework for the European Continent.

The European Datum 1950

Origin: Potsdam (Helmert Tower). 52°22’51.45”n Latitude 13°03’58.74”e longitude

Ellipsoid: International 1924

Prime Meridian: Greenwich

more
4 0 4,113
SimonKettle
Occasional Contributor III

Introduction

In Part 1 of this series we saw the setting for the development of a proto European-wide datum by the Germans. This super-National Datum was originally driven from the need of political and military powers in central Europe to comprehensively understand the world around them. Part 2 of the story will concentrate on the Second World War and the Allied military operations that ultimately led to the creation of the European Datum of 1950.

“During the war the German Army also connected triangulations of other European nations to [the German national datum]" Hough 1948

Before 1939 the responsibility with Military Survey at the British War Office was vested in the Geographical Section of the General Staff known as MI4. This Section operated under the Director of Operations and Intelligence, was headed by a Royal Engineer Colonel. Typically the Royal Engineer Colonel would be assisted by Royal Artillery and Infantry Officers. This speaks to the principal application of Military Survey, artillery bombardment and infantry navigation. During the inter-war period a Geodetic sub-section was setup to acquire foreign survey and triangulation data. With increasing evidence in the 1930's that Germany was intending and preparing to launch another war a programme to comprehensively map (and update) the whole of north-eastern France and Belgium (at 1:50,000) began. This effort was led by Colonel P. K. Boulnois under War Office control. To see some of these maps have a look at the plates included in the HMSO book. After the Munich Agreement in 1938 and war with Germany becoming inevitable survey officers were assigned to units for mobilisation. To see more detail concerning MI4 and its organisation see HMSO "Maps and Survey" Books from the War Office e.g. Chapter 01.

War was declared on Germany on the 1st September 1939 after the German invasion of Poland.

By June 1940 the German’s had triumphed in the Battle of France which Adolf Hitler coined "the most famous victory in history”. During the Battle of France the defending British Expeditionary Force was trapped along the northern coast of France, forced to scramble an evacuation of over 338,000 troops to England in the Dunkirk evacuation. After Dunkirk, Germany dominated Western Europe. The British Military reported to Prime Minister Winston Churchill on 4th October that even with the help of other Commonwealth countries and the United States, it would not be possible to regain a foothold in continental Europe in the near future.

Through this interlude where Allied forces fought Axis forces outside of Europe a plan for the invasion of Europe was developed.

Born out of war

The decision to undertake a cross-channel invasion within the next year was taken at the Trident Conference in Washington in May 1943.

Operation Overlord (D-Day)

The Allied operation that launched the successful invasion of German-occupied western Europe during World War II.

The U.S Office of the Chief of Engineers was deployed in WW2 and one of its commitments was to produce, with cooperation of the other allied groups, through revisions and new position readings (see here), battle field situation maps such as the Normandy Landings on 6th June 1944.

Millions of maps were produced throughout the war. The Normandy invasion alone required 3,000 different maps with a total of 70 million copies for keeping the military command fully aware of the operational situation on the ground, in the air and at sea. As the war progressed mapping became more small scale covering larger areas for strategic purposes and it quickly became apparent the lack of geodetic control the allies held over Europe. Probably through national jealously as well as security purposes very little geodetic data was publically available.

default.jpg

Army Group, 12th Engineer Section. August 2, 1944, HQ Twelfth Army Group situation map. Library of Congress Geography and Map Division Washington. http://www.loc.gov/item/2004629096/

HOUGHTEAM (October 1944 to September 1945)

This lack of geodetic data was particularly noticeable when pushing through France and into Germany making artillery bombardment inaccurate particularly so where shelling took place over the horizon and without seeing the target through gun sights. In this situation of shells going awry the Office of the Chief of Engineers formed a secret intelligence unit in 1944 (Hough, 1947), from the Army Mapping Service (AMS), that was allowed to operate throughout the European Theatre without restrictions. This unit was known as the HOUGHTEAM, named after U.S. Army Major Floyd W. Hough (Chief of the Geodesy Division of AMS) the unit consisted of a team of 3 commissioned officers, 10 enlisted men and 4 engineer consultants.

Their task was to move in behind infantry advancements with the aim of gathering as much cartographic and geodetic information as possible from the enemy, calculating the geodetic transformations into the military mapping system and passing the information onto the army and artillerymen in particular (Hough, 1947).

The HOUGHTEAM moved into Europe in September 1944 and set up in Paris to research and identify targets. The team spent time between in Paris as well as on the front typically arriving on the day it was cleared of enemy personnel. By the spring of 1945 the unit was in Germany and working with the 3rd and 7th armies, providing materials to survey and artillerymen greatly assisting in battle performance. During this time the team captured vital geodetic material for the occupation of Baden-Baden, Württemberg and Bavaria.

“…the war in Europe offered a unique opportunity to exploit known targets and thus to procure from enemy sources captured material of this type both for immediate use of artillery units and for preparation of operational maps.” Hough 1948

Saalfeld, Thuringia

The most famous raid of this unit was made in spring of 1945, when rumour had it that a cache of geodetic data and instrumentation was held in secret including data on parts of the USSR invaded by Germany. On chance when visiting a hospital for wounded Germany soldiers this rumour was confirmed which led to the discovery on April 17th of a huge cache (Bottoms, 1992) in the village of Saalfeld in Thuringia. Interestingly Saalfeld is close (only ~50Km south west) to the town of Jena in the Jena Valley home of Zeiss Optik, the legendary photogrammetry-equipment company that manufactures just the equipment that HOUGHTEAM were hunting, perhaps the team were exploring this area with this knowledge.

The cache, found in a remote warehouse on the outskirts of Saalfeld turned out to include the entire geodetic archives of the German Army! (Mindling and Bolton, 2008)

In true world war two stories of adventure, the discovery of these documents didn’t finish this story, instead the reader noting the location of Saalfeld and the time of discovery little time was left for grabbing the materials (the advancing Red Army was within days of occupying the town), of which there were 90 tons (Mindling and Bolton, 2008), this equated to around 75 truckloads of geodetic data, maps and instruments that needed transport to Bamburg in the American Occupation Zone.

In realising the difficult logistical task ahead for the HOUGHTEAM the Soviets had already began moving in to their zone of occupation.

According to the story in Life Magazine (12th May 1958)...

“Hough hurriedly borrowed trucks from a U.S artillery unit and the last of them loaded with data was just clearing one side of the village, rushing for the U.S zone, when the Soviets moved in with their tanks on the other side”.

The materials were lifted completely by May 28th destined for Bamberg and onto Washington for evaluation and archiving.

Russian troops arrived in the city the next day.

The horde of information was huge including...

“triangulation surveys running from Moscow to Vladivostok carried out by Germans in the 1900’s planning of the Trans-Siberian Railway […] first order surveys done by the German army deep within the Soviet Union on the Eastern Front” [as well as] the inaccessible regions of the Communist Bloc countries” (Mindling and Bolton, 2008).

The importance of this cache, the realisation that the Soviets were also looking for this cache and its closeness to being compromised by the occupying Soviet forces is suggested by a short quote at a meeting of geodesists in Toronto a few years later where leading Russian delegates mentioned that ...“We have heard a lot about you, Mr. Hough".

The data gathered by the HOUGHTEAM throughout the Second World War, data from Spain into Russia formed the beginning of a framework for European wide geodetic datum and framework for ballistic missile target localisation.


Bottoms, D., 1992. Reference paper 79. World War II Cartographic and Architectural Bank of the National Archives Washington, D.C.Mindling, G., and Bolton, R., 2008. U.S. Air Force Tactical Missiles, 1949-1969, The Pioneers. Lulu.com
Hough, F., (1948) The adjustment of the Central European triangulation network. Bulletin géodésique 7(1) pp64-93

Mindling, G., and Bolton, R., 2008. U.S. Air Force Tactical Missiles, 1949-1969, The Pioneers. Lulu.com
more
3 3 4,276
BojanŠavrič
Esri Contributor

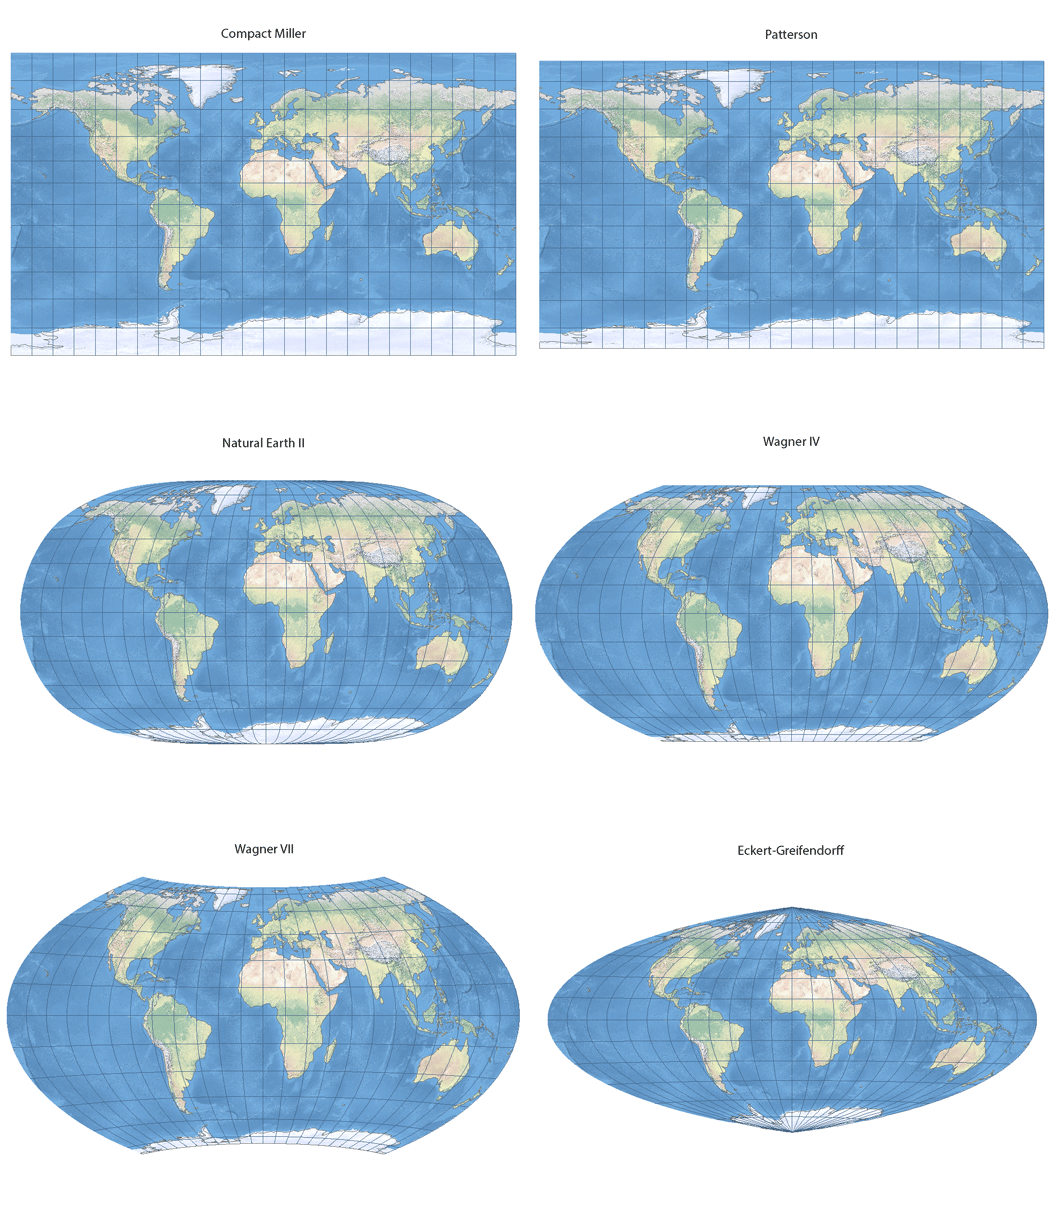
ArcGIS 10.4 now supports eight small-scale map projections displayed in an animated gif:

Compact Miller
Patterson
Natural Earth
Natural Earth II
Wagner IV
Wagner V
Wagner VII
Eckert-Greifendorff

The Eckert-Greifendorff, Wagner IV and Wagner VII are equal-area projections; the remaining five are compromise projections that try to minimize overall distortion. Sample definitions for the first seven projections are available in the Projected Coordinate Systems\World  and Projected Coordinate Systems\World(Sphere-based) folders.

The Eckert-Greifendorff, Wagner IV and Wagner VII also support ellipsoidal equations. Gnomonic, quartic authalic and Hammer projections are now available in ellipsoidal forms too.

With Eckert-Greifendorff, Hammer ellipsoidal, quartic authalic ellipsoidal, Wagner IV, and Wagner VII, one can select a custom central latitude and create oblique aspects of the projections.

New-Projections-ArcGIS-10.4.gif

ArcGIS 10.4 includes three variants of polar stereographic projection (variant A, B and C – EPSG codes 9810, 9829 and 9830 respectively) and two new variants of Mercator projection (variant A and C – EPSG codes 9804 and 1044 respectively). Mercator variant B (EPSG code 9805) was already included before as Mercator projection.

Mercator variants A and B have origin of northings / Y values at the equator. Variant A uses a scale factor at the equator to reduce overall scale distortion and effectively defines two standard parallels that are symmetric around the equator. Variant B takes a standard parallel and effectively forces the scale factor at the equator to be less than one. Variant C is similar to variant B, but with the addition of a latitude of origin. The origin of northings / Y values occurs at the latitude of origin.

The polar stereographic variant A is centered at a pole. The longitude of origin defines which longitude will be going straight “down” from the North Pole or “up” from the “South Pole” towards the middle of the map. A scale factor reduces the overall scale distortion and effectively defines a standard parallel. The variant B is similar to variant A, only that it takes a standard parallel to reduce the overall scale distortion of the projection and results in a scale factor at the pole of less than one. Variant C is similar to variant B, but with the addition of a latitude of origin. The origin of northings / Y values occurs at the intersection of the latitude of origin and the longitude of origin.

more
1 1 2,136
29 Subscribers