An easier place to search for coordinate systems...
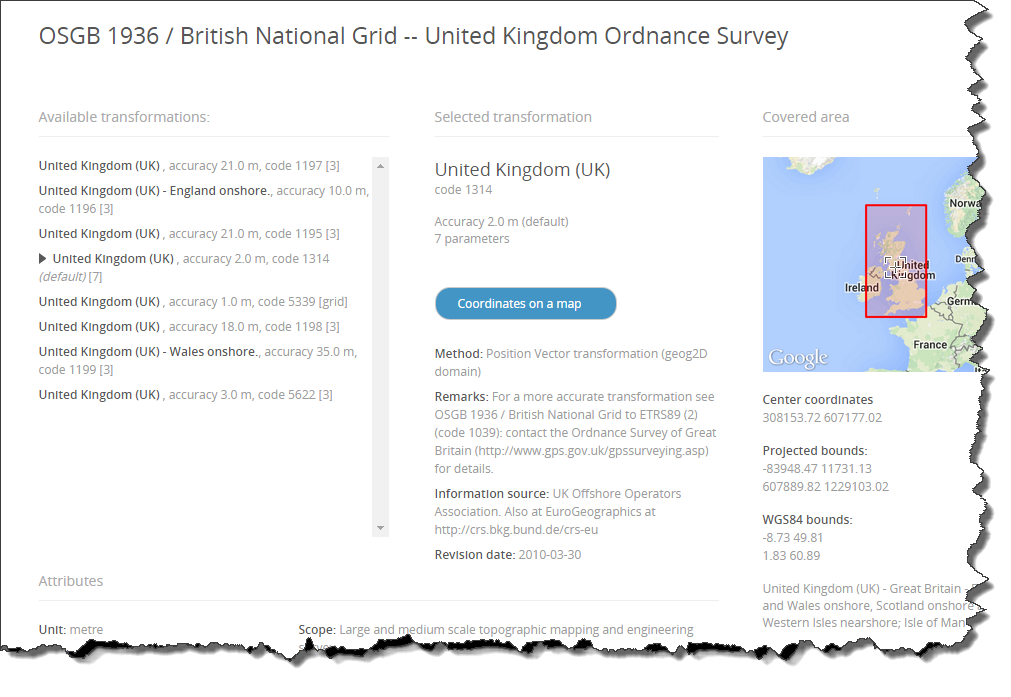
If you need a quick and easy to use resource for coordinate systems search try:EPSG.io. This is an open source web-service providing a database based on the official EPSG database that is maintained by OGP Geomatics Committee.
You can quickly search for an area, name and type like any other web-search engines.
For Example searching "United Kingdom" and click on the British National Grid result produces the following page:
A common question asked when working with Coordinate Reference Systems (CRS) in ArcMap is not only how to transform between different CRS but simply what transformations are available between two CRS in a given area?
There are several ways of finding this information with ArcMap:
Using the ListTransformation and SpatialReference Object
The spatial reference object allows you to interrogate a layer, features class, shapefile, raster or a coordinate reference name to view or manipulate a spatial object's properties. These include spheroidName, datumName, projectionName, scaleFactor and many more.
In the below example the code interrogates the names of two projections systems, prints their spheroid name, geodetic datum and a list of transformations that are valid between the two projection systems within the specified extent.
# Define from and to Spatial Reference names
fromSpatRef = arcpy.SpatialReference('European Datum 1950 UTM Zone 31N')
toSpatRef = arcpy.SpatialReference('WGS 1984 UTM Zone 31N')

# Print the spheroid name for fromSpatRef and toSpatRef
print("from SpatRef spheroid: " + fromSpatRef.GCS.spheroidName)
print("to SpatRef spheroid: " + toSpatRef.GCS.spheroidName)

# Print the datum name for for fromSpatRef and toSpatRef
print("from SpatRef datum: " + fromSpatRef.GCS.datumName)
print("to SpatRef datum: " + toSpatRef.GCS.datumName)

# Extent for Central North Sea (values can be found in the data frame)
extent = arcpy.Extent(533553, 6469886, 993268, 6179505)

# list transformations valid for Central North Sea region
outlist = arcpy.ListTransformations(fromSpatRef , toSpatRef, extent)
print str(outlist)
The ListTransformations function provides access to the list of transformations for a given area between any projection systems.
With this information it is possible to see a cut down list of what transformations are appropriate between any two CRS for a given area and investigate which of these is the appropriate method.
Further to this the syntax for a transformation method can be easily copy and pasted into other tools such as the Project Tool and can be used within a script such as the below.
# Set variables XY values can be presented as a list
x = 309905
y = 6320846
srIn = 'European Datum 1950 UTM Zone 31N'
srOut = 'WGS 1984 UTM Zone 31N'
Transform = 'ED_1950_To_WGS_1984_18'

# Create point geometry from xy variables and project to   srOut with Tranform method
pointGeometry = arcpy.PointGeometry(arcpy.Point(x,y),srIn,False, False)
projectedPoint = pointGeometry.projectAs(srOut, Transform)

# Copy the reprojected points to a shapefile
arcpy.CopyFeatures_management(projectedPoint,r"C:\Users\Documents\ArcGIS\Wells.shp")
A geodesic line is the shortest path between two points on a curved surface, like the Earth. They are the analogue of a straight line on a plane surface or whose sectioning plane at all points along the line remains normal to the surface. It is a way of showing distance on an ellipsoid whilst that distance is being projected onto a flat surface.
However there are several types of lines that have different definitions which are listed at the bottom of this blog.
Here's a video example of a geodesic line, the longest geodesic line possible without touching land.
The below image shows a planar distance in orange and the geodesic distance of that planar distance in blue. The maximum deviation of the geodesic from the planar line is near 2,000 Km and the difference in length is 644 Km.
What this image represents is the actual path taken (geodesic line) if I travel in a straight line, relative to me with no turns, from London to Singapore along the International 1924 ellipsoid (this is what I displayed the map in ArcGIS in EPSG:4022).
This type of measurement forms part of a series of geodetic features whose measurements account for the distortion of projected space. The distortion of a sphere into 2D space is nicely visualized in the video below:
Apart from what can be very large differences between geodetic and planar measurements, see the above example, in the real world these differences can have a legal consequence such as those seen in constructing license areas for oil and gas exploration and production, international boundaries and exclusive economic zones.
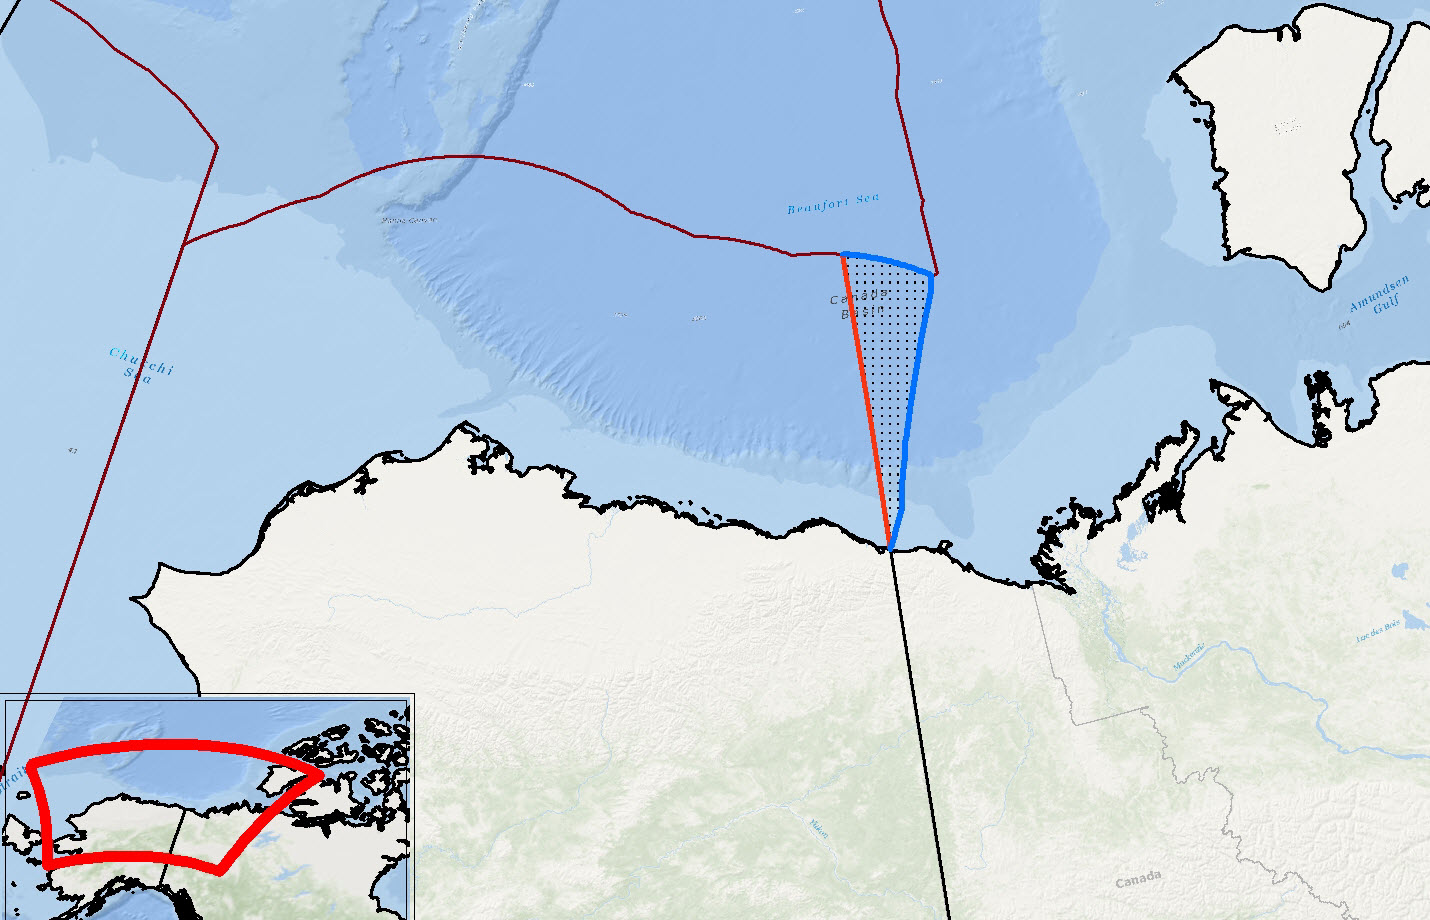
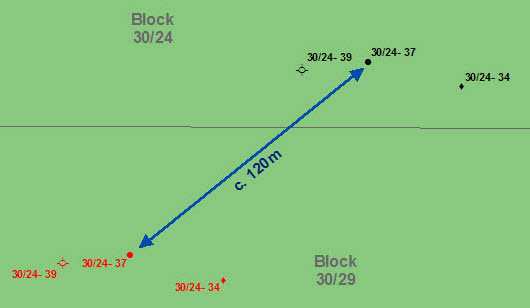
An example of geodesic line constructions having a political role is seen in the Beaufort Sea International Border dispute between Canada (Canadian Yukon) and The United States (Alaska). The maritime boundary between the two countries has been defined differently. Canada claims the boundary to be along the 141st meridian west out to a distance of 200 nautical miles, following the Alaska-Yukon land border (this is derived from the 1825 boundary treaty between Great Britain and Russia). The United States on the other hand define the boundary line as stretching out to 200 nautical miles perpendicular to the coast whilst being equidistant from the coast.
Red line is the Canadian boundary, Blue line the USA boundary and the stippled area is claimed by both parties.
Building Geodetic distances in ArcGIS
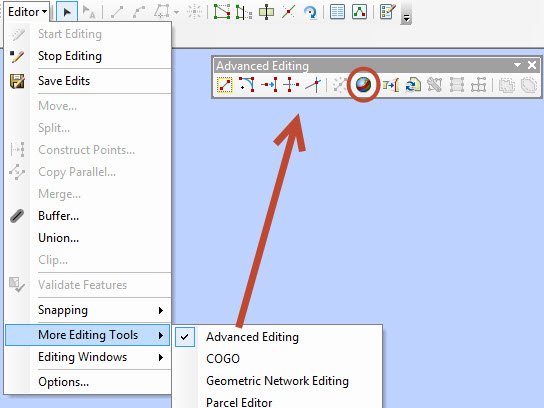
The features you draw in a normal ArcMap edit session are not geodetic (they are planar) unless you create them using either the Advanced Editor Construct Geodetic tool or one of the following geoprocessing tools: Bearing Distance To Line, Table To Ellipse, or XY To Line. Geodetic features do not account for changes in terrain, this is a topic for another blog.
Here I shall make the Canadian border line which is defined as 200 nautical miles offshore along the Canadian-US border following the 141st Meridian Line.
First I specify the line type (note the other types defined below)
Use the snapping tool to add my start vertex to the end of the border
Change the segment type to Distance - Direction and specify the distance covered (changing it to Nautical Miles)
Specify the direction of the line
Now the line is constructed according to the chosen ellipsoid and is saved as a new feature upon saving edits.
Geodesic line—The shortest line between any two points on the Earth's surface on a spheroid (ellipsoid). One sample use for a geodesic line is when you want to determine the shortest distance between two cities for an airplane's flight path. Another example is the creation of the path between the point of impact and the point of origin of a missile. This is also known as a great circle line if based on a sphere, rather than an ellipsoid. The geodesic line type allows you to create lines only. In addition, you can create a multi-segment line which is a series of geodesic lines that make up a single line feature. You can use a multi-segment line when you want to create an airplane's flight path with waypoints, such as an air route with multiple stops that make up a full route.
Geodesic circle—A shape whose edge is defined as a particular geodetic distance from a fixed point. Depending on the coordinate system in which it is displayed, it may not appear to be a circle. You might use this if you are creating a range ring of a weapon system, such as to show a weapon's effective range. Geodesic circles can be used to create either lines or polygons.
Geodesic ellipse—A shape whose sum of geodetic distances from a fixed pair of points is a constant. You could use this to create a signal error ellipse. This is also known as a geodesic circle when the major and minor axes are the same length. The geodesic ellipse type allows you to create lines or polygons.
Great elliptic—The line on a spheroid (ellipsoid) defined by the intersection at the surface by a plane that passes through the center of the spheroid and the start and end points of a segment. This is also known as a great circle when a sphere is used. The great elliptic type allows you to create lines only.
Loxodrome—A loxodrome is not the shortest distance between two points, but instead defines the line of constant bearing, or azimuth. Great circle routes are often broken into a series of loxodromes, which simplifies navigation. This is also known as a rhumb line. The loxodrome type allows you to create lines only.
Something extra to try:
A cool app to see the effect of the project on a straightline:
There are two tools in ArcGIS Desktop associated with using coordinate reference systems that often cause confusion. I believe these confusions are mainly sourced from the semantics surrounding projections and the tools in question.
Define Projection: This tool overwrites the coordinate system information in a dataset
This means only use the Define Projection tool on a dataset that has no coordinate system applied or to a dataset you know for certain has the wrong projection.
Project: This tool projects a dataset from one coordinate system to another through transformation or conversion
Use the Project tool when you want to convert a dataset from one coordinate system to another. For example when converting from ED_50_UTM_31N to ED_50_UTM_30N or when transforming between ED_50_UTM_31N and WGS84_UTM_31N
The Geodetic Glossary (2009) defines height as ‘distance, measured along a perpendicular, between a point and a reference surface’. This definition is concise and direct but leaves a vagueness concerning the reference surface. This reference surface is the Vertical Datum. A datum is required to reach accurate and reliable measures of height above a surface.
The EPSGdataset currently lists 128 vertical datums worldwide. There are various types of height including:
Ellipsoidal (The difference between the topographic elevation and the ellipsoid)
Orthometric(The difference between the topographic elevation and the geoid)
Geoid (The difference between the ellipsoidal height and the geoid surface Note this can be negative)
Heights are categorized into two types, those with reference to the Earth's gravity field and those defined on geometry alone. It is important to note that the two categories of height are not directly interchangeable as they are completely different. Where the gravity field heights are based on the geoid that is defined by a eqipotential surface compared to, for example, the height of a tree using right angle geometry where ground level is defined as 0 height.
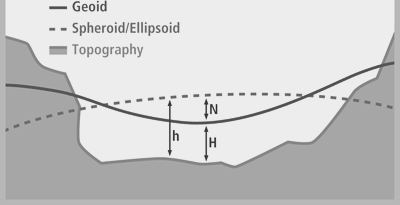
Figure 1 Difference between the Geoid and Spheroid/Ellipsoid based surfaces and real topography (adapted from ESRI 2012) where h = Ellipsoidal height, N = Orthomatric height and H = Geoid height.
In my experience height is colloquially referred to as X units above or below Mean Seal Level (MSL). Sea level comes from the Earth' gravity field, therefore gravity is studied to understand height.
So, what is mean sea level?
In its simplest form MSL is the average location for the surface of the ocean measured over time to minimise random and periodic variation, such as tides and storm surges. The period of time to measure these variations in the ocean surface was set at 19 years by the U.S. National Ocean Surface, these measurements can be brought together to form a tidal datum.
However in this form MSL is not adequate as a global vertical datum as this mean calculation only exists at the station of measurement and its immediate vicinity, plus the ocean has a dynamic topography that is nicely summarised in this MinutePhysics video.
I work in the Oil and Gas industry and the application of a correct vertical datum is important in exploration, when defining a height or depth to a geological surface, and also when designing and implementing infrastructure projects such as pipelines, ports and other coastal infrastructure as well as when considering the environmental impacts that spills and other developments may have on coastlines and rivers. For example misunderstanding the vertical datum can impact planning for a storm surge that may have been measured on a different surface when compared to the height of a constructed LNG plant.
In essence there are 2 types of datums used in Vertical Coordinate Reference Systems:
Geoid-based versus Spheroid/Ellipsoid-based
The Geoid is a reference surface of the Earth and is based on the relationship between gravitational force and gravitational potential that produces a surface where all points are perpendicular to the force of gravity. Meyer (2010) provides an extensive review on the Geoid and the physics behind its construction. This surface is considered the proper surface to create geodetic heights and will nominally correspond to mean sea-level (see the previous video).
Recently there has been a move to see if data from the Gravity field and steady-state Ocean Circulation Explorer (GOCE)ESA project is able to be used with calculating heights and connecting height systems (see here). This will create a very high resolution Geoid for calculating heights across the globe.
Some examples of Geoid surfaces include:
EGM2008 Geoid
EGM84 Geoid
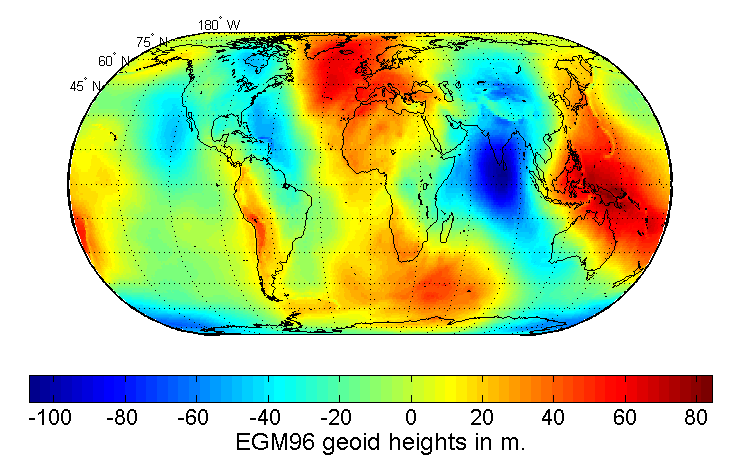
EGM96 Geoid
Spheroid/Ellipsoid-based surfaces use geometric calculations to define the local datum and a spheroid.
It is important to note that it is impossible to transform between the geoid and Spheroid/Ellipsoid-based datums. This is because there are no common elements between the two reference systems and no site-specific gravity measurements in a spheroid/ellipsoid system so no mathematical transformation can be applied.
Some examples of Spheroidal/Ellipsoid-based surfaces found in ArcGIS 10.2 include:
D_Cyprus_Geodetic_Reference_System_1993
D_Kuwait_Oil_Company
D_St_Lucia_1955
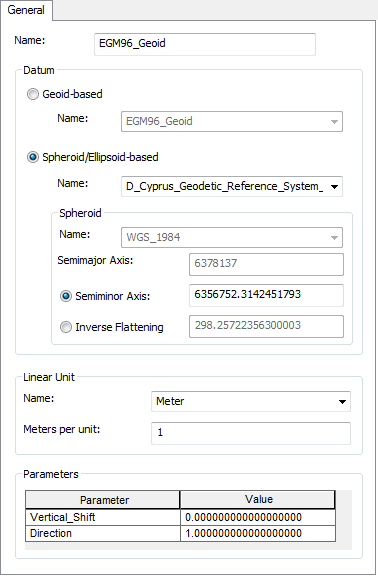
Figure 2 Example of the difference parts that make up a Vertical Datum as presented in ArcGIS.
The Geoidhas a more complex surface than a Spheroid/Ellipsoid-based surface where the Spheroid/Ellipsoid-based surface shows a constant rate between chosen parameters of calculation whilst the geoid is ‘bumpy’ indicating the changing gravity measurements that represent the ‘real’ topography of the Earth (Figure 3).
How do you set a vertical coordinate system in ArcGIS
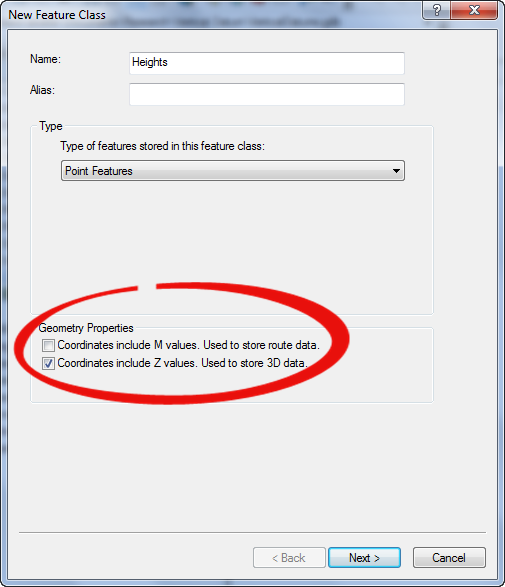
When creating a new feature class tick the “Coordinates include Z values” option. This will enable the 3D measure of the feature class (Figure 4).
Figure 4 New Feature Class: Select Z values to enable 3D use
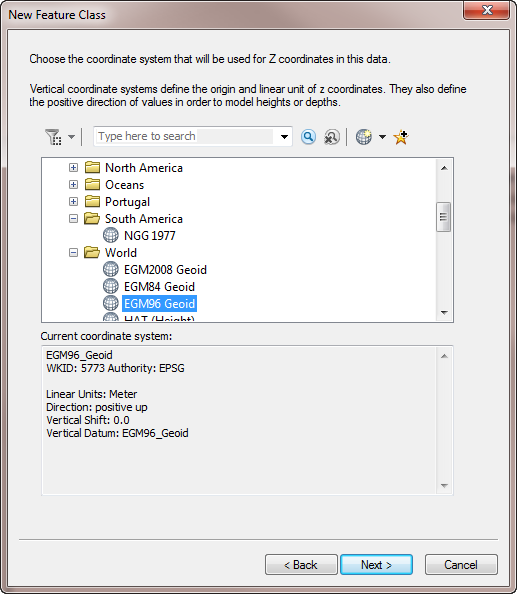
Click ‘Next’ to select the Geographic/Projected Coordinate System you want to use and then select the Vertical Coordinate System you would like to use.
Figure 5. Choose the correct vertical coordinate system for you area of interest. Note that local Vertical CRS have been calculated from locally derived measurements and that MSL (Depth) and MSL (Height) use the EGM96 Geoid.
Summary and How to transform between Vertical Coordinate Reference Systems in ArcGIS?
Geoid-based vertical coordinate reference systems are lightly connected to their geographic coordinate system (GCS) and therefore almost any Geoid-based vertical coordinate reference system may be used with any GCS since they include a vertical datum as part of their definition.
Spheroid/Ellipsoid-based coordinate reference system defines heights that are referenced to the spheroid of a geographic coordinate system. A geographic coordinate system’s spheroid may fall above or below the actual earth surface due to the mathematic parameters used in calculating the surface.
A Spheroid/Ellipsoid-based coordinate reference includes a datum, rather than a vertical datum definition and hence will follow those transformations used when switching between different GCS and PCS (Project Coordinate Reference Systems).
"It is vitally important to understand the difference between changing the coordinate reference system (CRS) property of a geographic dataset and converting the feature coordinates of a geographic dataset to a different CRS. Confusing them can lead to incorrectly located data and potentially some gross errors in the position of the features in your geographic data."
Follow these links to some useful blog articles on how to manage CRS in ArcGIS courtesy of @exprodat
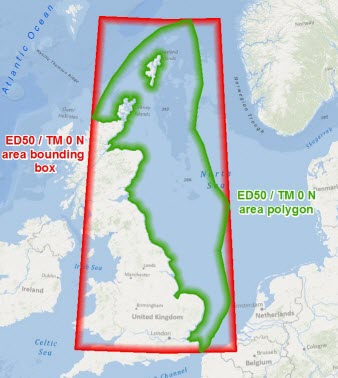
The International Association of Oil and Gas Producers (OGP) released EPSG Area Polygons in 2012 as a freely available spatial dataset that accurately defines the applicable extent of the CRSs and transformations in the EPSG Geodetic Parameter Dataset (EPSG Dataset).


 Using the ListTransformation and SpatialReference Object
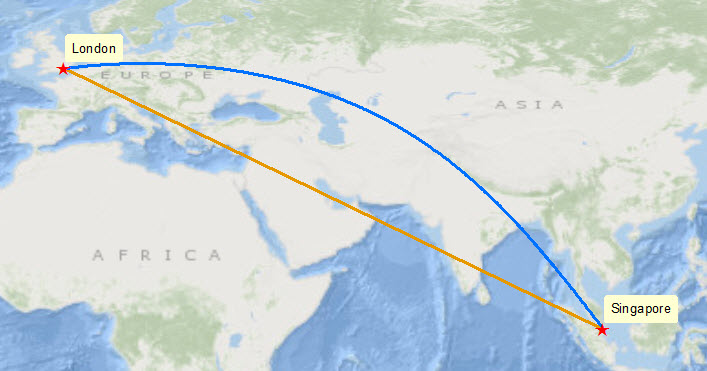
 Here I shall make the Canadian border line which is defined as 200 nautical miles offshore along the Canadian-US border following the 141st Meridian Line.
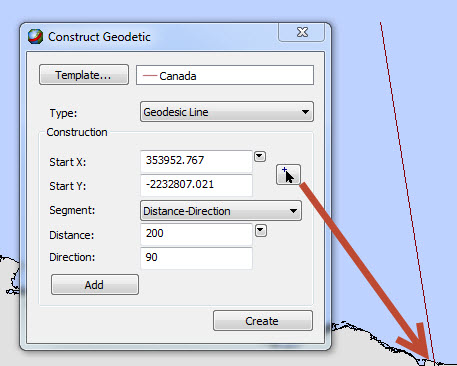 Now the line is constructed according to the chosen ellipsoid and is saved as a new feature upon saving edits.
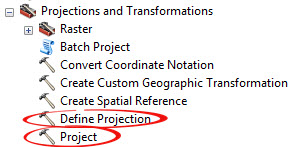