- Home
- :
- All Communities
- :
- Products
- :
- ArcGIS Web AppBuilder
- :
- ArcGIS Web AppBuilder Questions
- :
- Re: Chart options in webapp builder
- Subscribe to RSS Feed
- Mark Topic as New
- Mark Topic as Read
- Float this Topic for Current User
- Bookmark
- Subscribe
- Mute
- Printer Friendly Page
Chart options in webapp builder
- Mark as New
- Bookmark
- Subscribe
- Mute
- Subscribe to RSS Feed
- Permalink
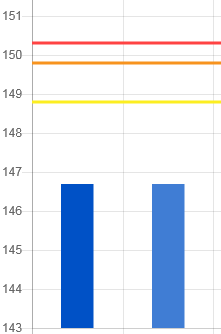
Is there anyway I can create a chart as follows in the webapp builder?any custom widget available?.
- Mark as New
- Bookmark
- Subscribe
- Mute
- Subscribe to RSS Feed
- Permalink
Hi Gunasekran,
Charting capabilities in Web AppBuilder are enabled with the Infographic widget,
Infographic widget—Web AppBuilder for ArcGIS | ArcGIS
Although, I don't think it can render exactly what your image shows. I know this is possible in Operations Dashboard for ArcGIS with the Serial Chart element.
Hope this helps,
- Mark as New
- Bookmark
- Subscribe
- Mute
- Subscribe to RSS Feed
- Permalink
Hi Derek,
Thank you. It is a mixed chart with a line(Y) and a bar(x) .Is there any way I can insert the js into the chart widget.I don’t know where I can insert my custom code taken from a chart.js
Just as below.
var myChart = new Chart(ctx, {
type: 'bar',
data: data,
options: options
});
At this point we have a standard bar chart. Now we need to convert one of the datasets to a line dataset.
var mixedChart = new Chart(ctx, {
type: 'bar',
data: {
datasets: [{
label: 'Bar Dataset',
data: [10, 20, 30, 40]
}, {
label: 'Line Dataset',
data: [50, 50, 50, 50],
// Changes this dataset to become a line
type: 'line'
}],
labels: ['January', 'February', 'March', 'April']
},
options: options
});
Please let me know ,if there is any possibilities.
Thank you
Joseph Irwin.
- Mark as New
- Bookmark
- Subscribe
- Mute
- Subscribe to RSS Feed
- Permalink
Hi Joseph,
Sorry, I am not a developer - so I can't help with your question. I suggest you re-post your 2nd post as a new question in this forum, Web AppBuilder Custom Widgets.
Also, since you mentioned,
> It is a mixed chart with a line(Y) and a bar(x)
Ops Dashboard does not support mixed charts. I thought your lines were guideline markings for the bar chart.
Hope this helps,