- Home
- :
- All Communities
- :
- Products
- :
- ArcGIS Spatial Analyst
- :
- ArcGIS Spatial Analyst Questions
- :
- How to colour in the spaces between two contour li...
- Subscribe to RSS Feed
- Mark Topic as New
- Mark Topic as Read
- Float this Topic for Current User
- Bookmark
- Subscribe
- Mute
- Printer Friendly Page
How to colour in the spaces between two contour lines?
- Mark as New
- Bookmark
- Subscribe
- Mute
- Subscribe to RSS Feed
- Permalink
Hello all,
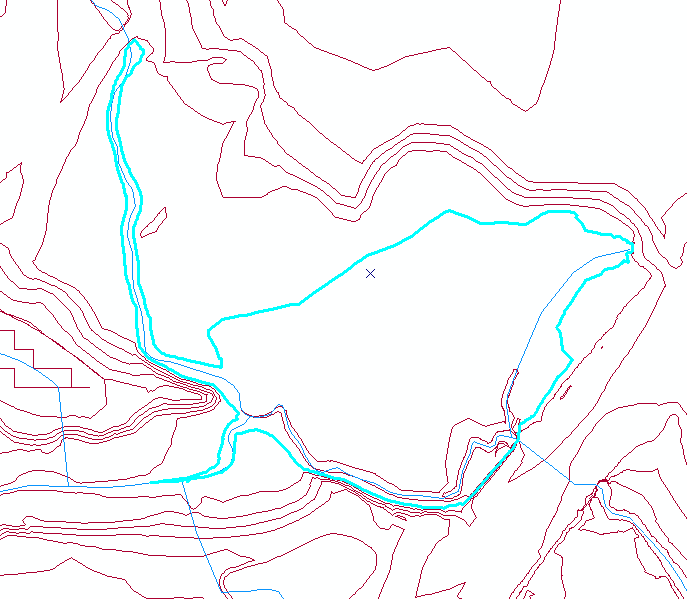
I am attempting to clearly identify infrastructure that will be submerged if water levels rose above a specific height due to the construction of a beaver dam in a stream. In the case of the image I attached, I am assuming a dam would block a culvert going beneath a road and raising the water level up stream by one meter. To get a better idea, I thought I would try filling in the area within a contour (as seen below, with 1 metre contours). Is there a way of colouring in the space between two contour lines? And to highlight that elevation on the map and any points that might exist in the coloured space? Looking at the image I attached, I would want to colour in the space within the cyan contour line.
Thank you!
Solved! Go to Solution.
Accepted Solutions
- Mark as New
- Bookmark
- Subscribe
- Mute
- Subscribe to RSS Feed
- Permalink
Raster to Polyline (Conversion)—ArcGIS Pro | Documentation
Feature To Polygon (Data Management)—ArcGIS Pro | Documentation
perhaps, at least for those that form closed loops
... sort of retired...
- Mark as New
- Bookmark
- Subscribe
- Mute
- Subscribe to RSS Feed
- Permalink
use the CONTOUR_POLYGON option
- Mark as New
- Bookmark
- Subscribe
- Mute
- Subscribe to RSS Feed
- Permalink
Is there a way to use the Contour_polygon tool without creating a new contour layer from scratch? When I use it, it asks for an Input Raster, but I'd rather use the contours that I already have.
- Mark as New
- Bookmark
- Subscribe
- Mute
- Subscribe to RSS Feed
- Permalink
Raster to Polyline (Conversion)—ArcGIS Pro | Documentation
Feature To Polygon (Data Management)—ArcGIS Pro | Documentation
perhaps, at least for those that form closed loops
... sort of retired...
- Mark as New
- Bookmark
- Subscribe
- Mute
- Subscribe to RSS Feed
- Permalink
This worked for the closed loop contours, thanks!