- Home
- :
- All Communities
- :
- Products
- :
- ArcGIS Spatial Analyst
- :
- ArcGIS Spatial Analyst Questions
- :
- Focal statistics problem values
- Subscribe to RSS Feed
- Mark Topic as New
- Mark Topic as Read
- Float this Topic for Current User
- Bookmark
- Subscribe
- Mute
- Printer Friendly Page
Focal statistics problem values
- Mark as New
- Bookmark
- Subscribe
- Mute
- Subscribe to RSS Feed
- Permalink
Hi,
I am using ArcGIS 10.1 and I am working with the Focal Statistics tool in order to get a smoother surface (I set "neighborhood rectangle 3x3 cell units" and as statistics type "mean"). The obtained result it looks like not so fine since the focal st. values seem increased respect to the input raster (see figures), but I don't understand the reason. The doubt arose making some comparison with other results in which the focal st. raster values are smaller than the input raster.
Could someone help me?
Thank you
- Mark as New
- Bookmark
- Subscribe
- Mute
- Subscribe to RSS Feed
- Permalink
Seeing the zero (0) in your data makes me wonder if you may have holes or voids in your original data. You may want to try and combine focal statistics with another function such as Elevation Void Fill, Fill, or possibly even Nibble depending upon your data type.
- Mark as New
- Bookmark
- Subscribe
- Mute
- Subscribe to RSS Feed
- Permalink
from Pro but the same for Map
Focal Statistics—Help | ArcGIS Desktop
The last optional parameter can have an effect on the results.
- Mark as New
- Bookmark
- Subscribe
- Mute
- Subscribe to RSS Feed
- Permalink
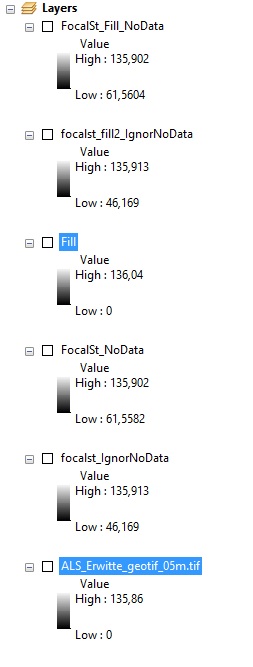
Thank you Lance Cole and Dan Patterson for your response. As suggested I tried to compare the focal st. results ignoring the NODATA, but in both cases the values were bigger than the input raster (see fig. "FocalSt_IgnorNoData" stands for the Ignore NoData flagged option, contrary to "FocalSt_NoData").
For what concerns the holes/voids, I used the Fill tool. The output raster had bigger values (see fig.), I presumed because of the filling operation, but using the new output for the focal st. I noticed the same problem (see fig.).
I am just wondering now if the problem is since the raster file "ALS_Erwitte_geotif_05m.tif" was generated in CouldCompare using nearly 8 get-together tiles. Each tile was represented by a .csv containing the coordinates points of the entire area.
What do you think?
Thank you!
- Mark as New
- Bookmark
- Subscribe
- Mute
- Subscribe to RSS Feed
- Permalink
What is the nodata value in the input rasters set to in all cases?
And can you confirm that you have nodata areas in the rasters especially the ...05.tif file. That one may be the culprit
- Mark as New
- Bookmark
- Subscribe
- Mute
- Subscribe to RSS Feed
- Permalink
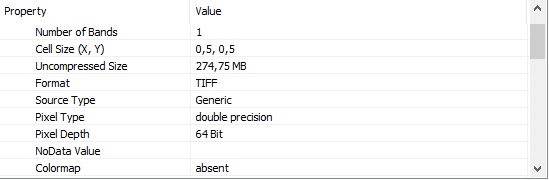
Concerning the "nodata value in the input rasters set", I meant the "ignore_nodata" set (optional) in the focal st. window tool.
Regarding the "...05.tif" file, it showed no nodata, as you can see in the fig.
Therefore, according to what you wrote the nodata lack in the input file ("...05.tif") may be the problem, at this point. In order to get a smoother surface, how could I solve this issue?
I wanted a smoother surface to use it as input for the least cost path analysis, in order to avoid that the process could take into account small and medium surface variations/modern structures (such as a street or a roundabout) during the path estimation.
- Mark as New
- Bookmark
- Subscribe
- Mute
- Subscribe to RSS Feed
- Permalink
Roberto, the nodata value may not have been set, it doesn't mean that there are areas that shouldn't be treated as nodata.
If this is a dem, it would be unlikely that you would have '0' unless your area is at sea level. If it is some other file type (ie landuse), then It would be useful to know what the areas of low value (near or at 0) represent
- Mark as New
- Bookmark
- Subscribe
- Mute
- Subscribe to RSS Feed
- Permalink
Well, the file is a DGM and the csv file (forming the tiles) containing just x, y and z information. Unfortunately, the site from which I downloaded the files didn't say anything about nodata and the only data, about min and max values that I have, are those given by the raster value scale in the layer panel (as in the previous fig.).
That's the problem.
- Mark as New
- Bookmark
- Subscribe
- Mute
- Subscribe to RSS Feed
- Permalink
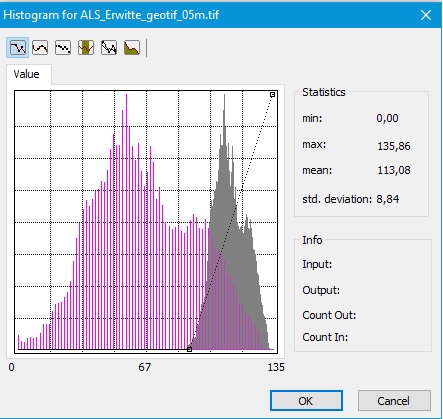
If the lowest elevations ie 0's don't make sense for your area (ie sea level) there is a good chance that 0 is the nodata value.
It would be worthwhile looking at the histogram of the symbology to see it that is indeed the case
- Mark as New
- Bookmark
- Subscribe
- Mute
- Subscribe to RSS Feed
- Permalink
I am afraid that, as you said, the 0 represents the nodata. Also in the histogram is reported the lowest value as 0 (see fig.). So the data has been stored like this, although not being at the sea level (it is an area of northern Germany).