Turn on suggestions
Auto-suggest helps you quickly narrow down your search results by suggesting possible matches as you type.
Cancel
- Home
- :
- All Communities
- :
- Products
- :
- ArcGIS Spatial Analyst
- :
- ArcGIS Spatial Analyst Questions
- :
- Re: Excel point data to contour maps
Options
- Subscribe to RSS Feed
- Mark Topic as New
- Mark Topic as Read
- Float this Topic for Current User
- Bookmark
- Subscribe
- Mute
- Printer Friendly Page
Excel point data to contour maps
Subscribe
4957
2
10-10-2012 09:29 PM
10-10-2012
09:29 PM
- Mark as New
- Bookmark
- Subscribe
- Mute
- Subscribe to RSS Feed
- Permalink
Well here goes - ive been hitting my head on a wall the last couple of hours and i'm hoping that someone here can help me out with a project i'm trying to finalise. Thanks in advance.
I have a mass of drilling data and the aim will be to model between similar rock units. For instance each hole has a unit in it that I will call "Sandstone". I would like to prepare a layer that shows the variabiliy of this layer (contour this feature across my designated area)
I have started out preparing the data in excel.
All the data has locational data and associated rock information below that point. I am in the process of ensuring the naming of the units is the same.
Now to the ESRI query - ive been experimenting with different options within spatial analyst. So far I have been getting the best results just using the default settings from "Spline".
Ive been selecting for instance the "Sandstone" unit within my spreadsheet (ive got around 20 boreholes in there at the moment)
So my question: is this the preferred way to approach this type of problem? Is spline the most suitable choice? How do I set contours with a set spacing (eg 100m).
Any advice regarding this process would be greatly appreciated.
If anyone can direct me to a resource dealing with this process that would also be great.
If you require further information please let me know.
2 Replies
10-11-2012
05:13 AM
- Mark as New
- Bookmark
- Subscribe
- Mute
- Subscribe to RSS Feed
- Permalink
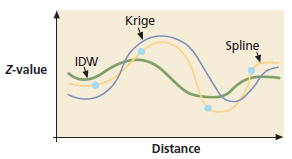
You have a lot going on in that statement. I am not sure what you mean by 100 meter spacing? Do you mean 100 meter interval? Contours are usually reported in terms of intervals not spacing. Spline is fine for rubbersheeting as some of the other interpolations have other algorithms to balance it, but if you are looking for the interpolation to match the point value at the point then spline works fine. [ATTACH=CONFIG]18360[/ATTACH]
There is a older document that discusses the way the interpolations look at the values in the point that helps that I am attaching as well as the document that discusses it from ArcNews. So once you have the raster you should be able to generate the contours at a 100 meter interval to get the desired results.
There is a older document that discusses the way the interpolations look at the values in the point that helps that I am attaching as well as the document that discusses it from ArcNews. So once you have the raster you should be able to generate the contours at a 100 meter interval to get the desired results.
10-11-2012
03:13 PM
- Mark as New
- Bookmark
- Subscribe
- Mute
- Subscribe to RSS Feed
- Permalink
Yes I mean 100m interval 😜
Spline is definitely the correct choice - as the values im modelling are known and measured.
Thanks for your help
Spline is definitely the correct choice - as the values im modelling are known and measured.
Thanks for your help