- Home
- :
- All Communities
- :
- Products
- :
- ArcGIS Spatial Analyst
- :
- ArcGIS Spatial Analyst Questions
- :
- Re: Analysis of overlaying rasters
- Subscribe to RSS Feed
- Mark Topic as New
- Mark Topic as Read
- Float this Topic for Current User
- Bookmark
- Subscribe
- Mute
- Printer Friendly Page
- Mark as New
- Bookmark
- Subscribe
- Mute
- Subscribe to RSS Feed
- Permalink
Hi everyone,
I have around 1000 raster data layer. Every single one represents a distribution range of a species.
In the attribute table of each raster data layer are the body measurements of the specimen (there is only
one row per attribute table).
I am looking for a method in which I could calculate for each pixel the mean body size of the overlaying rasters.
Is there something like that? It would be best if I could repeat that for severals columns in the attribute table.
Is there a more or less simple solution for this problem? Haven't found anything till now..
Many thanks,
Nicolas
Solved! Go to Solution.
- Mark as New
- Bookmark
- Subscribe
- Mute
- Subscribe to RSS Feed
- Permalink
Could you attach a few input rasters, so I can adapt the code that I'm writing to work with your data and check some of the details?
Kind regards, Xander
- Mark as New
- Bookmark
- Subscribe
- Mute
- Subscribe to RSS Feed
- Permalink
Hi Xander,
Here some of the (plain) rasters that I am working with (the body measurements I added later as join).
https://www.dropbox.com/sh/awgeiugv9tp3e2t/AAD1Z7od31qNsXgQc_AKzylea?dl=0
Nicolas
- Mark as New
- Bookmark
- Subscribe
- Mute
- Subscribe to RSS Feed
- Permalink
Is it possible to add the tables corresponding to the raster you uploaded too? That way I can have a look it the joining can be included in the process or that another method then the one I'm working on is more appropriate.
Kind regards, Xander
- Mark as New
- Bookmark
- Subscribe
- Mute
- Subscribe to RSS Feed
- Permalink
Hi Nicolas,
I think with Spatial Analyst it is possible to do the whole calculation in raster data model using the Cell Statistics tool Peter mentioned. You can use the Lookup tool to recode values of your input rasters and create separate sets of rasters for each parameter like Body Length, etc.
Here is a sketch of how I would try to do it (not tested and may not apply to your folder structure).
Note that most Spatial Analyst operations produce NoData cell whenever any input cell is NoData. You may want to replace NoData with zero for your calculation or explore the effects of ignore_nodata parameter of the Cell Statistics tool.
import arcpy
import os
arcpy.CheckOutExtension("Spatial")

in_raster_folder = r'c:\path\to\folder\with\all\rasters'
column = "Body Length"
out_folder = r'c:\path\to\folder\to\store\body_length'

# get list of all input rasters
arcpy.env.workdpsace = in_raster_folder
in_rasters = arcpy.ListRasters()

recoded_rasters = []
for ras in in_rasters:

    # Recode the raster so that VALUE stores the desired variable
    lookedup = arcpy.sa.Lookup(ras, column)

    # replace NoData with Zero
    recoded = arcpy.sa.Con(arcpy.sa.IsNull(lookedup), 0.0, lookedup)

    # save the recoded raster to disk
    recoded_path = os.path.join(out_folder, os.path.basename(ras))
    recoded.save(recoded_path)

    # remember all the recoded rasters so you can average them later
    recoded_rasters.append(recoded_path)

# calculate mean of all the recoded rasters
means = arcpy.sa.CellStatistics(recoded_rasters, "MEAN", "NO_DATA")
means.save(r'c:\path\to\save\mean\body_length')

arcpy.CheckInExtension("Spatial")
- Mark as New
- Bookmark
- Subscribe
- Mute
- Subscribe to RSS Feed
- Permalink
Hi Filip Král,
The Lookup is a good way of creating a raster with the values of the attribute. I wonder if a Cell Statistics on 1000 rasters will work.
You should however, not set the background to 0, since this will mess up the mean value (they will be included). The option "DATA" is the right option for CellStatistics keeping the NoData values in the separate rasters.
The other point is, in the input data 2 out of three columns do not have values, but strings. At least this was provided in the sample data. If this is representative for the input raster, they should be corrected for.
Kind regards, Xander
- Mark as New
- Bookmark
- Subscribe
- Mute
- Subscribe to RSS Feed
- Permalink
Thanks for the correction, Xander Bakker, I see, of course including the zeros would increase N therefore the mean would be lower since mean = sum(x_i)/N. The "DATA" option it is then.
I also have doubts whether CellStatistics can handle 1000 rasters and would be curious to know what worked in the end for Nicolas Beerli .
Regards,
Filip.
- Mark as New
- Bookmark
- Subscribe
- Mute
- Subscribe to RSS Feed
- Permalink
Hey thanks for all the suggestions... I am going to try what works.
I had also a new idea to solve the problem. The idea is to create a table like this:
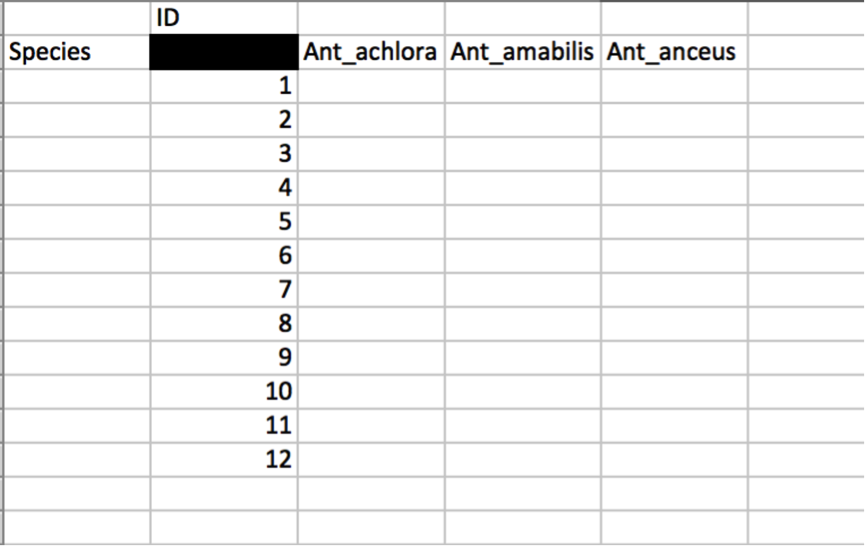
Each column represents one species and each row one cell (100 * 100 km). In each cell I going to write whether a species is present (1) or absent. If I am somehow able to create such a table it is pretty easy to calculate the median, the mean or add any other information to each cell (when I add a other column, row).
To do that, I am going to create for each raster cell a point feature (which has the similar ID like rows in my table).
What I was thinking is to have my species ranges all merged as polygon (without any measurements data in the attribute table). Somehow it should be possible to extract the present species into a point per raster?
This table I could then import in R for further analysis. The Problem of course could be the size of this table (approximately 1000 columns * 7000 rows...) Somebody idea whether that works or not?
- Mark as New
- Bookmark
- Subscribe
- Mute
- Subscribe to RSS Feed
- Permalink
It could work... The table could be generated with the help of numpy arrays. Converting the rasters to numpy array is easy if the raster have the same extent (and number of rows and columns). Excel can have more than 16000 columns, so it should fit.... but I wonder if it is the best way to do this.
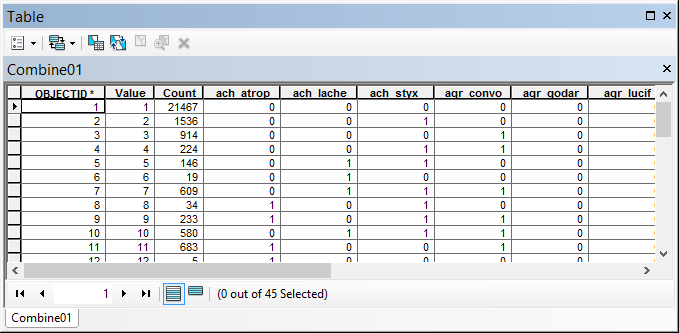
Maybe evaluating another possibility is using Combine (before any join). This will create a raster that contains every unique combination of input rasters and a (in this case huge) attribute table. However, also the number of rasters may be a limitation for this process.
- Mark as New
- Bookmark
- Subscribe
- Mute
- Subscribe to RSS Feed
- Permalink
mmmm, perhaps Combine is not going to be the solution, since it supports only up to 20 rasters (would require more than 50 steps). The result is a raster with an attribute table holding all the species that occur (as you are looking for)...
- Mark as New
- Bookmark
- Subscribe
- Mute
- Subscribe to RSS Feed
- Permalink
a pity this table looks exactly like what I want.
here again the link this time with the table