- Home
- :
- All Communities
- :
- Products
- :
- ArcGIS Spatial Analyst
- :
- ArcGIS Spatial Analyst Questions
- :
- Re: Analysis of overlaying rasters
- Subscribe to RSS Feed
- Mark Topic as New
- Mark Topic as Read
- Float this Topic for Current User
- Bookmark
- Subscribe
- Mute
- Printer Friendly Page
- Mark as New
- Bookmark
- Subscribe
- Mute
- Subscribe to RSS Feed
- Permalink
Hi everyone,
I have around 1000 raster data layer. Every single one represents a distribution range of a species.
In the attribute table of each raster data layer are the body measurements of the specimen (there is only
one row per attribute table).
I am looking for a method in which I could calculate for each pixel the mean body size of the overlaying rasters.
Is there something like that? It would be best if I could repeat that for severals columns in the attribute table.
Is there a more or less simple solution for this problem? Haven't found anything till now..
Many thanks,
Nicolas
Solved! Go to Solution.
Accepted Solutions
- Mark as New
- Bookmark
- Subscribe
- Mute
- Subscribe to RSS Feed
- Permalink
mmmm, perhaps Combine is not going to be the solution, since it supports only up to 20 rasters (would require more than 50 steps). The result is a raster with an attribute table holding all the species that occur (as you are looking for)...
- Mark as New
- Bookmark
- Subscribe
- Mute
- Subscribe to RSS Feed
- Permalink
If indeed you have separate rasters, have you examined out the Cell Statistics tool in ArcToolbox (with the nodata option selected)
- Mark as New
- Bookmark
- Subscribe
- Mute
- Subscribe to RSS Feed
- Permalink
Yes, Cell Statistics would be the right tool if it only had a field where I could access the columns of the attribute table (as parameter). The values that I was going to use to calculate the mean are in the attribute table.
- Mark as New
- Bookmark
- Subscribe
- Mute
- Subscribe to RSS Feed
- Permalink
So let me get this clear...you have 1000 rasters each with a table with multiple attributes.
What is each raster classed upon? How many rows and columns are there in raster? (and I assume that they overlap exactly and have the same cell size)
- Mark as New
- Bookmark
- Subscribe
- Mute
- Subscribe to RSS Feed
- Permalink
The aim of this analysis is to have each cell show the mean wing length, body length & thorax width of all species which occur in the pixel. So in the end, I hope to have three rasters which show me all of the three measurements, and therefore show me the spatial distribution of the average body size (either wing length, body length or thorax width).
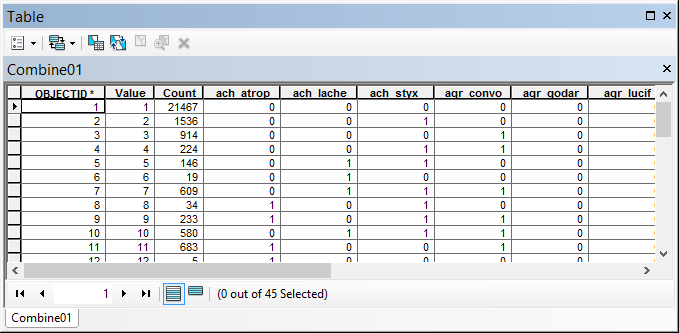
Yes I have 1000 rasters each with a attribute table like this:

All rasters are classified as 1 (equal presence of the species).
Each single cell of the rasters overlap exactly and have the same cell size. But the raster themselves have different extensions.
One cell is 100 * 100 km. The study area is the whole "old world." (so theoretically there would be a maximal of 205 columns and 141 rows possible)
Many thanks!
- Mark as New
- Bookmark
- Subscribe
- Mute
- Subscribe to RSS Feed
- Permalink
Interesting... although it doesn't sounds as the most appropriate format to store this type of information. What I would probably do is this:
- batch convert the rasters into polygons
- merge them all into 1 featureclass (this should have the polygon(s) of each raster and the attributes are assumed to be the same
- Intersect this featureclass with a featureclass that holds the extent. In this step the overlapping features in the merged featureclass are also intersected.
- Create unique label points (inside each polygon) and for each label point (best stored in a dictionary) extract the information of the overlapping data (attributes).
- Aggregate the data as you desire (also register the number of species per polygon) and create an output without overlap with the stats linked to it.
It did something similar (although) completely different, when I wanted to make a heatmap of visits based on a log of a map service. The extents listed in the logs, were merged into 1 featureclass (many overlapping features) and to determine the visits I simply intersected the featureclass with an extent featureclass of my AOI and did the analysis with the label points in a dictionary.
If you are willing to share a small set of data I can see if I can adapt the code to works with it...
Kind regards, Xander
- Mark as New
- Bookmark
- Subscribe
- Mute
- Subscribe to RSS Feed
- Permalink
Hi,
That sounds like a good way to handle this data. I`ve already done the first 2 steps you suggested and I`m going to try the others.
It would be wonderful if you could have a quick look at it. Here is a sample:
https://www.dropbox.com/sh/8mkvc3sbt33dtik/AACBOX6oqEHEYmWRD-wFhm80a?dl=0
P.S. You mentioned the "batch" function. Just discovered that as a good alternative to the "iterate," in the model builder- thanks! I like it because it goes a lot faster. But what I still struggle with, is that batch is the output name. Is there anything like %name% possible in batch?
Best regards, Nicolas
- Mark as New
- Bookmark
- Subscribe
- Mute
- Subscribe to RSS Feed
- Permalink
I would probably use a Python script to "batch" process the data.
What I also saw in your data is that the fields TW_SMUNDI_ and FL_SMUNDI_ are text field. The values in these fields should be converted (in the script) to double (float) to be able to calculate some statistics.
I just created a new featureclass and added a rectangle polygon that covers the entire area and did an intersect between the rectangle and the provided polygons. The 12 polygons converted to 97 polygons.
This intersect featureclass I used to do a simple test on the field BL_SMUNDI_:
- I add two fields:
- XB_Keep (will be filled with value 1 for those polygons I want to keep) and
- Mean_BL that will hold the mean value
- I loop through the polygons and create two dictionaries:
- dct_geo that will hold the JSON geometry (to check if a polygon already exists in the dictionary) plus a list of oid's that have the same geometry
- dct_att that will hold the oid versus the value from the field BL_SMUNDI_
- In the next loop I calculate the mean value for each unique geometry, using the list of oids and the related dictionary with oid and values
- the result is written to a dictionary dct_res that holds the first oid of the unique geometry and the mean value calculated
- The last cursor is to write those values back to the input featureclass
import arcpy
fc_in = r"C:\Forum\SpecieRasters\data.gdb\intersect"
# fc_out = r"C:\Forum\SpecieRasters\data.gdb\result01"
# fld1 = "TW_SMUNDI_" # text field!
fld2 = "BL_SMUNDI_"
# fld3 = "FL_SMUNDI_" # text field!
fld_keep = "XB_Keep"
fld_res = "Mean_BL"
if len(arcpy.ListFields(fc_in, wild_card=fld_keep)) == 0:
arcpy.AddField_management(fc_in, fld_keep, "LONG")
if len(arcpy.ListFields(fc_in, wild_card=fld_res)) == 0:
arcpy.AddField_management(fc_in, fld_res, "Double")
dct_geo = {}
dct_att = {}
flds = ("OID@", "SHAPE@", fld2)
with arcpy.da.SearchCursor(fc_in, flds) as curs:
for row in curs:
oid = row[0]
polygon = row[1]
val = row[2]
dct_att[oid] = val
j = polygon.JSON
if j in dct_geo:
lst_oid = dct_geo = lst_oid
else:
dct_geo = [oid]
del row, curs
dct_res = {}
for j, lst_oid in dct_geo.items():
lst_val = [dct_att[oid] for oid in lst_oid]
tot = sum(lst_val)
cnt = len(lst_val)
mean = tot / float(cnt)
dct_res[lst_oid[0]] = mean
flds = ("OID@", fld_keep, fld_res)
with arcpy.da.UpdateCursor(fc_in, flds) as curs:
for row in curs:
if row[0] in dct_res:
row[1] = 1
row[2] = dct_res[row[0]]
curs.updateRow(row)
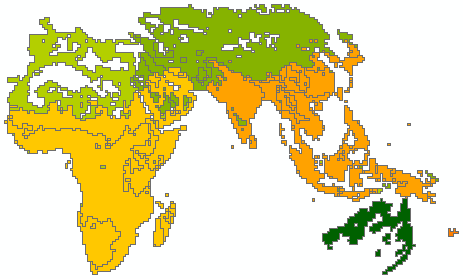
del row, cursWhen you query the output featureclass using XB_Keep = 1 you and display on Mean_BL the result looks like this:
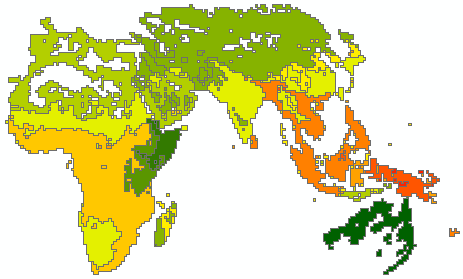
as opposed to drawing the overlapping input polygons on BL_SMUNDI_:
I will adapt the code to make it a bit friendlier and to correct for the string input fields that hold values.
Kind regards, Xander
- Mark as New
- Bookmark
- Subscribe
- Mute
- Subscribe to RSS Feed
- Permalink
Thanks a lot for showing me this solution! What I was wondering
1. Do you think that the intersecting is also possible with 1000 polygons?
2. Is there a good way to convert the product polygon (out of your calculations) back into raster with keeping all the calculated mean values? Because what I finally want to do with this data is a analysis whether there is a correlation between bodysizes and latitude or not (and I also going to test my data against climate data etc). What I need to conduct this analysis is to have cells with a exact geographic position and the mean bodysize.
Many thanks, nicolas
- Mark as New
- Bookmark
- Subscribe
- Mute
- Subscribe to RSS Feed
- Permalink
Hi Nicolas Beerli,
1. Do you think that the intersecting is also possible with 1000 polygons?
I think it is possible, but there is only 1 way to find out... Let's try it!
2. Is there a good way to convert the product polygon (out of your calculations) back into raster with keeping all the calculated mean values?
If you convert the resulting polygon featureclass, using each of the columns calculated (3), and specifying in the environment settings that the result should use the same extent as the input rasters and snap to the raster too, it will be OK.