- Home
- :
- All Communities
- :
- Products
- :
- ArcGIS Pro
- :
- ArcGIS Pro Questions
- :
- Re: Tracking Analyst in Pro
- Subscribe to RSS Feed
- Mark Topic as New
- Mark Topic as Read
- Float this Topic for Current User
- Bookmark
- Subscribe
- Mute
- Printer Friendly Page
Tracking Analyst in Pro
- Mark as New
- Bookmark
- Subscribe
- Mute
- Subscribe to RSS Feed
- Permalink
Most of the functionality of Tracking analyst can be found in the time property of a layer.
One big functionality that we miss is to draw Tracks (lines) between points when you play them in time and to be able to label just the newest point.
Is there any plans to have Tracking analyst in Pro or to have similar functionality in the core product?
Thanks
Mody
- Mark as New
- Bookmark
- Subscribe
- Mute
- Subscribe to RSS Feed
- Permalink
Not on the radar on the last Roadmap
and in the help... nope
Tools that are not available in ArcGIS Pro—Appendices | ArcGIS Desktop
except for
One of the most commonly used features of Tracking Analyst, the data clock, is available as a core chart type. Learn more about data clocks in ArcGIS Pro
No mention either in 2.5 Beta 3 and not a mention on ArcGIS Ideas
Flagging
in case I have missed any reports
- Mark as New
- Bookmark
- Subscribe
- Mute
- Subscribe to RSS Feed
- Permalink
Hi Dan
Checked all these resources too before I publish my question.
Hope to get some answer or some kind of workaround.
My only workaround is to create a line feature class from the points where every line is connecting two adjacent points (in time) and have the same time stamp and ID and then play this layer.
Not very elegant...
- Mark as New
- Bookmark
- Subscribe
- Mute
- Subscribe to RSS Feed
- Permalink
Have you looked into Stream Layers in ArcGIS Pro? Stream layers—ArcGIS Pro | Documentation
The documentation on symbolizing stream layers also says that "When a stream layer is track aware, only the current observations are labeled." which sounds like what you're after.
- Mark as New
- Bookmark
- Subscribe
- Mute
- Subscribe to RSS Feed
- Permalink
Hi Kory
Stream layers is a good option if there is a way to replay old data with stream layer. Is there any way to do it?
Maybe feed GeoEvent with txt file?
- Mark as New
- Bookmark
- Subscribe
- Mute
- Subscribe to RSS Feed
- Permalink
Hello Mody Buchbinder –
In an older post, Generating Tracks from Events, I had suggested perhaps using a GeoEvent Server Incident Detector to output a polyline rather than point output to allow point position reports to be drawn with a track line. My experience since has suggested that at any real velocity / volume this is a bad idea.
A more recent thread, Geoevent: Create Line from Points, I mention that a "reconstruct tracks" processor we had considered implementing for GeoEvent Server ended up being implemented as part of GeoAnalytics Server.You can read more about that capability here: Reconstruct Tracks
Eric Ironside has some additional comments in that thread on using stream services, or perhaps the GeoEvent Server's Motion Calculator. These would be more traditional GeoEvent Server integration with an ArcGIS Enterprise portal web map (or ArcGIS Online web map) than ArcGIS Pro. I mention them only as alternatives to consider. I suspect that what Kory Kramer and Tanu Hoque have offered using stream layers and query layers in ArcGIS Pro is what you are looking for.
– RJ
- Mark as New
- Bookmark
- Subscribe
- Mute
- Subscribe to RSS Feed
- Permalink
Hi RJ
Thanks for the answer I understand this option.
The only problem is that now they can just open ArcMap and replay some data on screen.
All other option need much more complex products and licenses for very simple task.
I just think this basic functionality (add tracks and different symbol for the tail) should be added to the time properties for layer...
Thanks again
Mody
- Mark as New
- Bookmark
- Subscribe
- Mute
- Subscribe to RSS Feed
- Permalink
So this piles on to "All other option need much more complex products and licenses for very simple task."...I have the same problem, and same lack of desire/time/budget to replace what is normally a simple function with something that takes 5 more steps and twice the time.
So we're ingesting GPS collar data remotely, and we need to see the track and direction of the animal over the last 7 days. The following SQL assumes you can get your hands on a SQL DB. The key line of code here is SHAPE.ShortestLineTo(LEAD(SHAPE) OVER (ORDER BY [LMT_DATE])) which orders the GPS points as line vertices in order of time stamp, which not only gives me the track, but orients it in the direction of travel so I can symbolize it with the arrow. I run this nightly, so each day we can look at where the bears are headed (Not kidding, many arrows point to Krispy Kreme!) for the last 7 days.
SET QUOTED_IDENTIFIER ON;
DECLARE
@sql VARCHAR(5000),
@COLLAR_ID VARCHAR(128)
TRUNCATE TABLE [dbo].[GPS_COLLAR_PATH]
DECLARE gandgCursor CURSOR
FOR
SELECT DISTINCT COLLAR_ID FROM [dbo].[GRSM_GPS_COLLAR]
ORDER BY COLLAR_ID ASC
OPEN gandgCursor
FETCH NEXT FROM gandgCursor
INTO @COLLAR_ID
WHILE ( @@FETCH_STATUS = 0 )
BEGIN
SET @sql = '
SET QUOTED_IDENTIFIER ON
DECLARE @Now DATETIME = GETDATE();
DECLARE @7DaysAgo DATETIME = DATEADD(day,-7,@Now);
INSERT INTO [dbo].[GPS_COLLAR_PATH](
[OBJECTID],
[SHAPE],
[COLLAR_ID],
[GPS_POS_NUMBER],
[ANIMAL_TAG],
[EVENT_ID],
[ANIMAL_TYPE],
[LMT_DATE]
)
SELECT
[OBJECTID],
SHAPE.ShortestLineTo(LEAD(SHAPE) OVER (ORDER BY [LMT_DATE])) ,
[COLLAR_ID],
[GPS_POS_NUMBER],
[ANIMAL_TAG],
[EVENT_ID],
[ANIMAL_TYPE],
[LMT_DATE]
FROM [dbo].[GRSM_GPS_COLLAR] WHERE [COLLAR_ID] = '''+@COLLAR_ID+''' AND [LMT_DATE] BETWEEN @7DaysAgo AND @Now;
'
PRINT 'Executing Statement - '+ @sql
EXEC (@sql)
FETCH NEXT FROM gandgCursor
INTO @COLLAR_ID
END
CLOSE gandgCursor
DEALLOCATE gandgCursor- Mark as New
- Bookmark
- Subscribe
- Mute
- Subscribe to RSS Feed
- Permalink
Hi Thomas Colson,
That is an excellent idea!!!
If you think it makes sense for your use case, you can follow the steps provided in the blog post that I mentioned in my last comment to make it dynamic (i.e. showing the latest always) and get rid the nightly task to create a new table with last 7 days worth of day. Plus you can use time slider to see how they traveled as time passed.
In fact based on your idea (again thanks for that), I came up another solution to draw lines from those points.
Here are flight paths (when no time is provided)

... that are created from these points
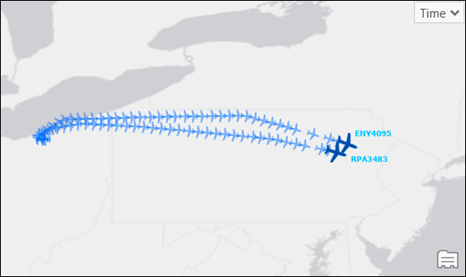
The line layers has only two features instead of multiple features representing each segment of the polyline (which is btw something needed for some cases)
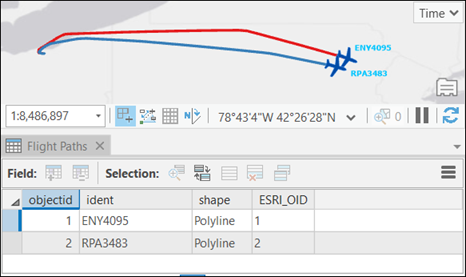
Now if you enable time slider, you can play back how these flights moved.

Here is the SQL (for SQL Server) that i used.
select
ROW_NUMBER() OVER (ORDER BY ident) as objectid,
ident,
geometry::STLineFromText
(
concat('LINESTRING (', coord, ')'),
4326
) as shape
from (
select ident,
string_agg
(
concat(shape.STX, ' ', shape.STY), ', '
) within group (order by clock)
as coord
from flightawarepositions
WHERE ::r:time
group by ident
) aor a bit different version without subquery:
select ident,
objectid = ROW_NUMBER() OVER (ORDER BY ident),
shape = geometry::STLineFromText
(
concat
(
'LINESTRING (',
string_agg
(
concat(shape.STX, ' ', shape.STY),
', '
) within group (order by clock),
')'
),
4326
)
from flightawarepositions
WHERE ::r:time
group by ident
NB:
1. for ::r:time syntax, please ArcGIS Pro doc here.
2. this is a very quick solution that I tried. I haven't tested whether it will hit any limits when it comes to concatenating large string
- Mark as New
- Bookmark
- Subscribe
- Mute
- Subscribe to RSS Feed
- Permalink
Hi Mody Buchbinder,