- Home
- :
- All Communities
- :
- Products
- :
- ArcGIS Pro
- :
- ArcGIS Pro Questions
- :
- Relating Tables one to many problems
- Subscribe to RSS Feed
- Mark Topic as New
- Mark Topic as Read
- Float this Topic for Current User
- Bookmark
- Subscribe
- Mute
- Printer Friendly Page
Relating Tables one to many problems
- Mark as New
- Bookmark
- Subscribe
- Mute
- Subscribe to RSS Feed
- Permalink
I have one csv. file with geologic core hole the fields are its name and its northing and easting. In my other csv. file I have the core log data, so each hole drilled has multiple rows of corresponding strata thickness in the core log. My related columns in both tables are the core hole name, so I am relating one to many. My problem is when I go to relate them and select the point on the map only the first row of data shows up and I have to arrow to the next row and so on, does anyone know how to make it show all the rows of data when I select the point on the map?
This is my first table I import and turn into a points layer. Everything here is fine and how I want it and in the right location.
| Drillhole name | Northing | Easting | Surface |
| 07RU01 | 564815 | 1809307 | 720 |
| 07RU02 | 563358 | 1809476 | 724 |
| 208-98-1 | 565786.1 | 1811581 | 750.81 |
| 208-98-2 | 565762.5 | 1810901 | 771.4 |
| 208-99-1 | 564668.1 | 1811355 | 800 |
| 208-99-2 | 566250.3 | 1811398 | 731.61 |
| 208-99-3 | 566602.4 | 1811059 | 728.6 |
| 2000-1 | 565024.6 | 1811063 | 633 |
I then bring in the table below, and try to relate it (not all data shown in the table below) but it only allows me to join. And from here I cannot get it to do what I want. Which is I would like to be able to relate the table and be able to click to point and see all the rows of drill hole data associated with that one point. Thanks for the help and I look forward to hearing back
| Drillhole name | Northing | Easting | Surface | Strata name | Bed Name | Key | Top Depth | Bot Depth |
| 07RU01 | 564815 | 1809307 | 720 | Limestone | CARTERS | y | 0 | 34 |
| 07RU01 | 564815 | 1809307 | 720 | Limestone | Lebanon | y | 34 | 150 |
| 07RU01 | 564815 | 1809307 | 720 | Limestone | RIDLEY | y | 150 | 250 |
| 07RU02 | 563358 | 1809476 | 724 | Limestone | CARTERS | y | 0 | 34 |
| 07RU02 | 563358 | 1809476 | 724 | Limestone | Lebanon | y | 34 | 148 |
| 07RU02 | 563358 | 1809476 | 724 | Limestone | RIDLEY | y | 148 | 250 |
| 208-98-1 | 565786.1 | 1811581 | 750.81 | Overburden | OVERBURDEN | n | 0 | 10 |
| 208-98-1 | 565786.1 | 1811581 | 750.81 | Limestone | Lebanon | y | 10 | 90 |
| 208-98-1 | 565786.1 | 1811581 | 750.81 | Limestone | RIDLEY | y | 90 | 250 |
| 208-98-2 | 565762.5 | 1810901 | 771.4 | Overburden | Overburden | n | 0 | 10 |
| 208-98-2 | 565762.5 | 1810901 | 771.4 | Limestone | Lebanon | y | 10 | 110 |
| 208-98-2 | 565762.5 | 1810901 | 771.4 | Limestone | RIDLEY | y | 110 | 250 |
| 208-99-1 | 564668.1 | 1811355 | 800 | Limestone | CARTERS | y | 0 | 23 |
| 208-99-1 | 564668.1 | 1811355 | 800 | Limestone | Lebanon | y | 23 | 122 |
| 208-99-1 | 564668.1 | 1811355 | 800 | Limestone | RIDLEY | y | 122 | 150 |
- Mark as New
- Bookmark
- Subscribe
- Mute
- Subscribe to RSS Feed
- Permalink
Ross,
What you have outlined should have worked. You should be able to create a relate based upon what you have outlined using the info tool our the related table display in the attribute table. Lets try the following out lining a local relate. You can also create a relate in the database rather then on the feature class in the MXD. Note, when you open the an attribute table of a FC with a relate, you cannot directly see the related data. Also, make sure you do not have any spaces in your field names for your tables.
- Create a new GDB somewhere easy to access
- In Catalog right-click on the GDB and select Import > Table (Multiple)

- Once the dialog appears select the boring and core log CSV files and click OK

- Add the two new tables to your MXD, if they did not automatically add. They will appear in the Table of Contents under the List By Source (second button).

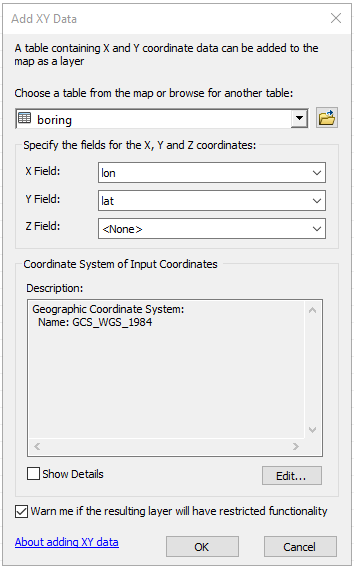
- In ArcGIS Desktop go to File > Add Data > Add XY Data
- In the dialog set the select the boring table you just added to your GDB and set the x-Field and y-Field corresponding to your data and Coordinate system as appropriate. Click OK. This will add the data from the table as points for the boring location data.
- Right click on the new feature in the TOC and select Joins and Relates > Relate
- In the Dialog, select the field the relate will be based on from the boring log, the corelog table and its related field and a name for the relate. Note the related field between the two tables must be the same type of data i.e. text to text. long to long, etc. You could use StrataName, BedName or a combination of the data.

- Open the boring log attribute table and select a record, and then click the Related table button in the top corner. The related records will be selected and displayed.

- You can also view this info the attribute window rather than the Attribute table. The info displayed can be adjusted buy changing the Display extension in the layer/table properties.

Additional info:
Importing a table (multiple) - ArcGIS Desktop
- Mark as New
- Bookmark
- Subscribe
- Mute
- Subscribe to RSS Feed
- Permalink
Ross,
The pictures did not upload, can you please edit your response. To insert images, you need to use the tool in the response toolbar.
You will not be able to see the related data directly in the point layer attribute table, disadvantage of a relate. In the top corner of your attribute table there should be a button called "Related Tables" when you hover over it. When you click the drop down the relate you created should be listed, click on it and it will display the related records in your core log table.
Also, make sure you created the relate between the boring point feature class and the core log table and NOT just between the two underlying tables.
- Mark as New
- Bookmark
- Subscribe
- Mute
- Subscribe to RSS Feed
- Permalink
Lance,
So I did what you outlined and it still did not work.
First I brought in both the table with the point location and the table with the multi lined information. Below is a picture of both tables being brought in and a attribute view of the Core locations table. Along with a picture of the multi lines table that I want to join to the locations table.


Next I took the locations table and created it into a point layer, everything comes out fine and accurate in the right spot. Which you can see below.

Now when I try to relate it I click on the point file displayed on the map and push new relate, and set up the fields accordingly. (Seen in photo below). Once I run this nothing really happens I click on the point layer in the maps attribute table and it is just the locations table shown I do not see any other choices to show or view the log data that I just joined. Also shown below.

What do I need to do to fix this? Thanks (It better work this time my bad)
- Mark as New
- Bookmark
- Subscribe
- Mute
- Subscribe to RSS Feed
- Permalink
Ross,
First, sorry I thought you were working in 10.x not Pro.
Second, when you added the tables, did you import them into your GDB as a new table or just add them to your project as CSV? Click on the List by Source icon (second one at the top of your TOC) and see if they are listed under your GDB or just a file path. Make sure you are selected this table in your GDB and not the actual CSV when performing the Relate
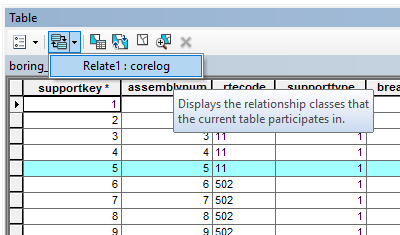
Third, my bad here for assuming you were on 10.x. Show related data is in a different location in Pro. Click on the three bar stack in the top right corner of the attribute table for your boring point data. Select Related Data > Name of your Relate (Relate1 ??). This will open another attribute window with the related records. Take a look at View related data - ArcGIS Pro. You can also set ArcGIS Pro to automatically select related records when one of the key records are selected.
- Mark as New
- Bookmark
- Subscribe
- Mute
- Subscribe to RSS Feed
- Permalink
I did what you outlined again and it still would not relate the table or show up on the map.
1. I added the two tables to my geodatabase, by clicking import tables and I brought them from a csv file on my computer into the geodatabase.
2. Then I went to geoprocessing and used the add join tool and it did not work. The one table shown in the contents is what is visible in the attribute viewer and is the product of my add join tool function from the two tables I brought into the geodatabase.

What do you recommend I do next or what am I doing wrong here? Thanks for all the help again and I look forward to hearing back from you.
- Mark as New
- Bookmark
- Subscribe
- Mute
- Subscribe to RSS Feed
- Permalink
The first thing I noted is I only see one table in your TOC and I also do not see the points feature class. Unfortunately, I cannot see all of the path so I cannot tell if the one table is in a GDB or it is a CSV.

Also, in item 2 of your post you noted you created a "join" but you show the relate tool and have created a relate. Again, you cannot see related data in a table like you do joined data. You need to use other tools to view the data such as the "Select Related Data" option in the attribute table or the "Explore" tool once it is related to a feature class.
Can you provide a copy of your CSV files (or a small sample of the two files that contains related data) and what coordinate system the data is in? I will gladly take a look at the data this evening and put together a more detailed workflow using your own data. This will also allow me to see if there are other possible issues. If you do not want to post your data online please provide an email address and I will reply to you personally.
To upload data to GeoNet, save your two CSV files as a ZIP and reply to the post here on GeoNet. Once you open a reply, click on the "Use advanced editor" at the top of your reply dialog. This will enable the option to attach documents at the bottom of the dialog.
- Mark as New
- Bookmark
- Subscribe
- Mute
- Subscribe to RSS Feed
- Permalink
another solution which might be better is to get the xy coordinates of the locations and add two fields (X & Y) to the data. then you can create pts from the csv file. the result will be many pts on top of each other. you can identify them to see the records or you can select them.
- Mark as New
- Bookmark
- Subscribe
- Mute
- Subscribe to RSS Feed
- Permalink
Is the table an Excel file or csv file or any table that lacks an ObjectID? If it is then relates and joined record selections are prohibited. See the help on the Fundamentals of Objectid fields. You have to convert Excel files and csv files to either a geodatabase table that has ObjectIDs or a dbf table that has FIDs to be able to create a relate or do joined record selections. The table conversion probably should occur before you use the XY Table to Point Layer tool for all tables involved in your relates or joins or for the point layer table you could export the point layer created by the tool to transform the in-memory layer the tool creates (which may lack a proper ObjectID if the table source is a csv file) into a permanent on-disk geodatabase point feature class (which will automatically generate an ObjectID field). The Table to Table tool can be used to do the conversion of a csv file into a geodatabase table.
- Mark as New
- Bookmark
- Subscribe
- Mute
- Subscribe to RSS Feed
- Permalink
Ross,
Let's try this again...
1) Create a new ArcGIS Pro project called "LogSample" using a just a Map template. Make sure to check to create project files.
2) Save the two CSV file to a easily accessible location such as your Desktop. Anywhere is fine as long as you know where they are located or if you already have them accessible.
3) Using the XY Table to Point tool in the geoprocessing tab set:
- Input Table - point to the Rutherford Core Location.csv (on my Desktop can be on any drive)
- Output Feature Class - point to the LogSample.GDB that was created when starting the project and set the feature class to CoreLocation
- X Field - Easting, Y Field - Northing, Z Field - Surface
- Coordinate System to NAD83, StatePlane Tennessee (US FT) and NAVD88 (Height). Note, you may need to clear both the vertical and horizontal to None before trying to set the state plane system. This dialog can be quirky while setting the parameters.
- Click Run, accept the transformation and this will add the points to the map as 3D points
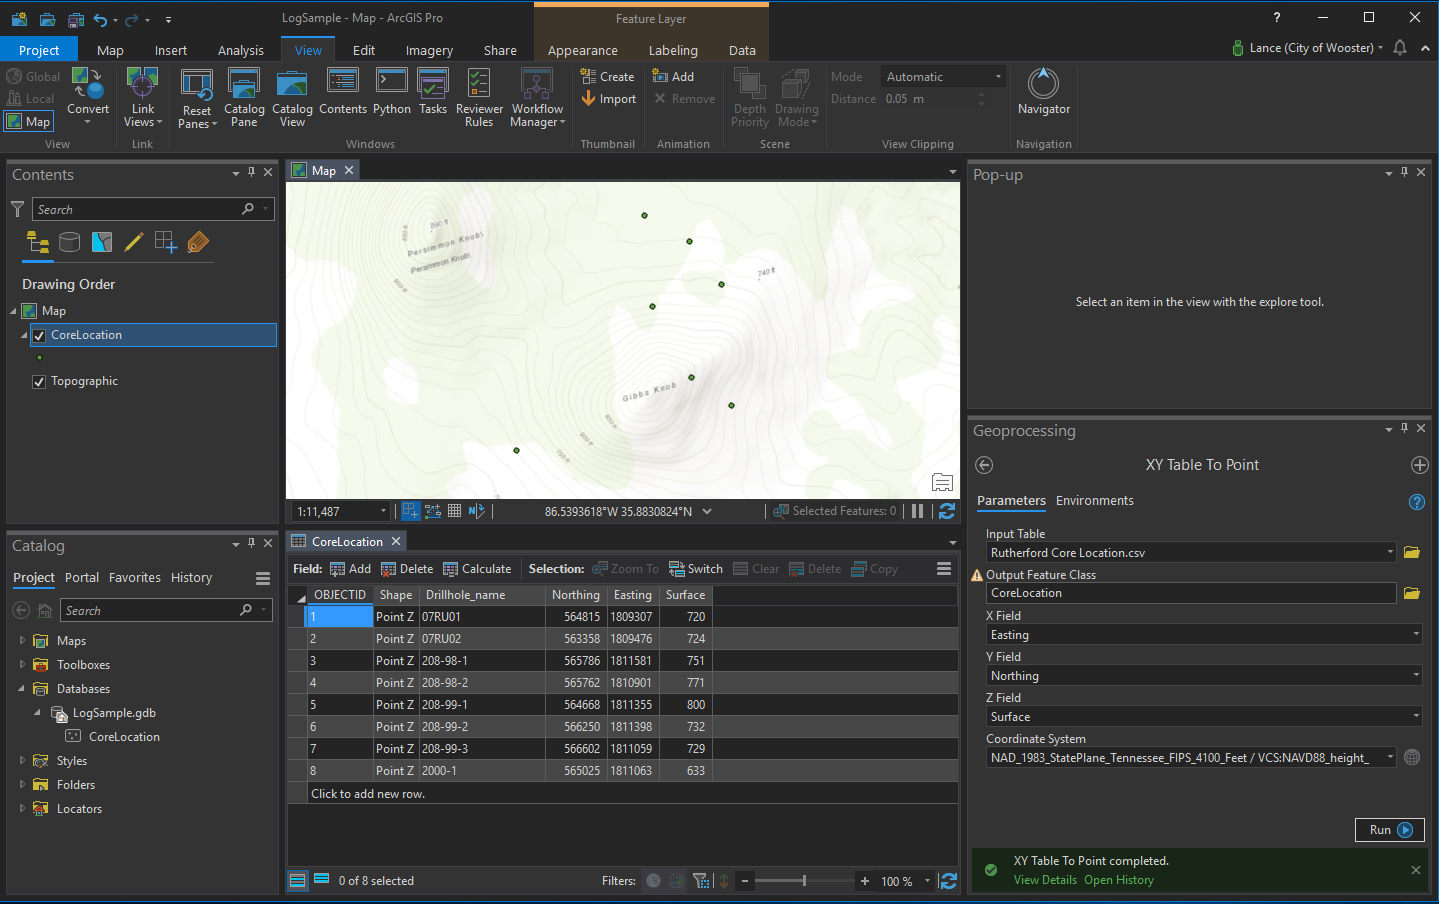
You can see "CoreLocation" feature class has been added to the map as well as the "LogSample" database.
4) Next lets add the core log CSV to the database as a Table. In Geoprocessing, open the Table to Table conversion tool. Set the following:
- Input Rows - browse to the RutherfordCore Log.csv location and select the file
- Output Location - Browse to the LogSample.gdb and select the database
- Output Name - Input "CoreLog"
- Click Run, this till create a table in the LogSample.gdb and add the table to your map
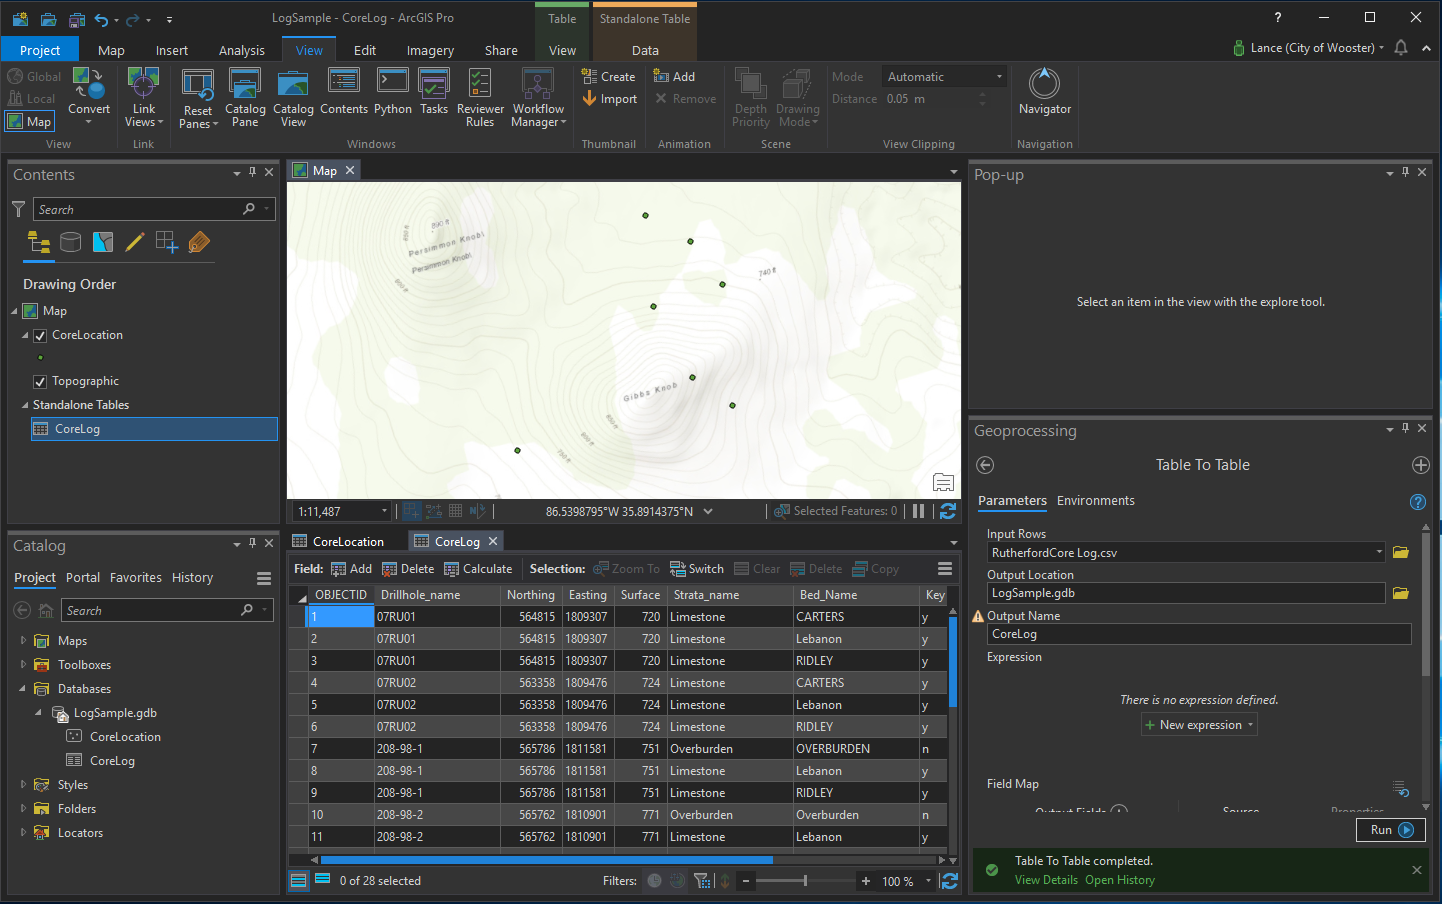
You can now see the CoreLog table added to the map and LogSample.gdb. This is not the CSV file but an actual table in the GDB.
5) Now you can create the relate in the project. In the Geoprocessing widow open the Add Relate tool and set the following parameters. One big note here - this creates the relate in the project not the database therefore it is not accessible outside of the project. You can also Create Relationship Class in the database that will persist outside of the project. For simplicity, I am construction the relate in the project.
- Layer Name or Table View - select "CoreLocation" from the dropdown
- Input Relate Field - select "Drillhole_name" from the dropdown
- Relate Table - select "CoreLog" (should already be selected automatically)
- Output Relate Field - "Drillhole_name"
- Relate Name - leave as Relate1 or choose what you would like to name the relate
- Cardinality - "One to many"
- Click Run, this will add the relate to the "CoreLocation" feature class linking to the "CoreLog" table
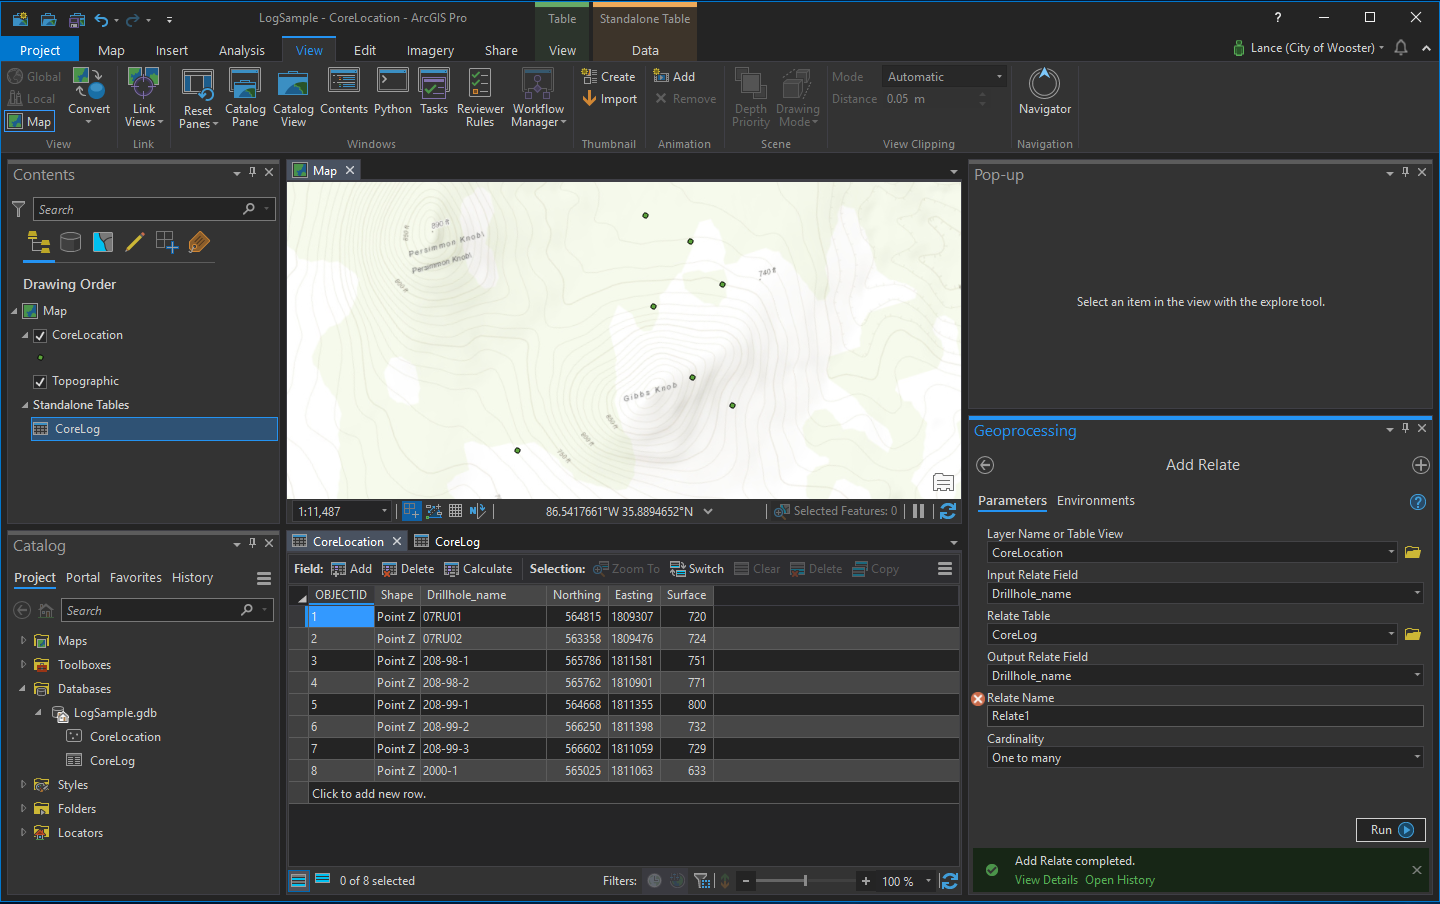
The relate completed and as you can see, nothing is added to the CoreLocation attribute table. As noted previously, related data is not visible in the attribute table for the feature to which the data is related.
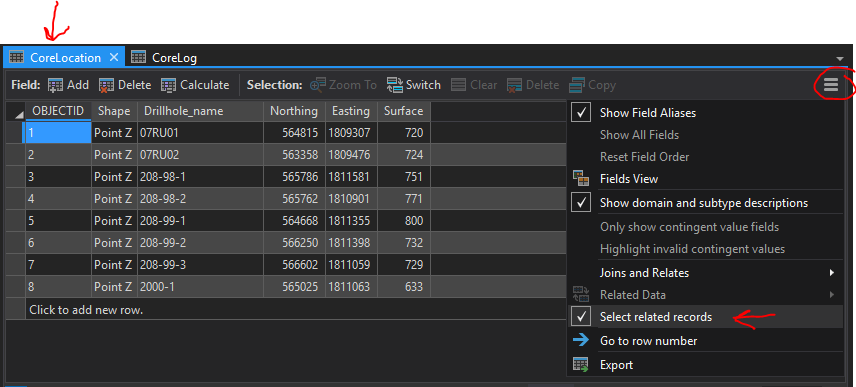
6) To view the data we need to make a few changes. You should currently have two attribute tables open - CoreLocation and CoreLog.
- Select the CoreLocation attribute table and click on the three bar stack in the top right corner of the attribute window. Once the dialog displays, check or turn on Select related records. If it is already checked you are good to go.
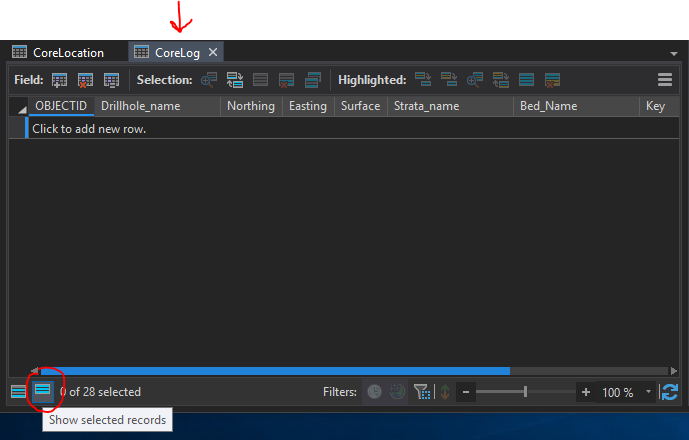
- Select the CoreLog attribute table. In the bottom left corner turn on the Show selected records filter. Once checked, no records should now be displayed rather then all.
7) Leaving the CoreLog Attribute table active, go to either the Map or Edit ribbon. Click on the Select tool and select one of the core location points in the map. The CoreLog attribute table should automatically filter displaying the core information applicable to the selected location.
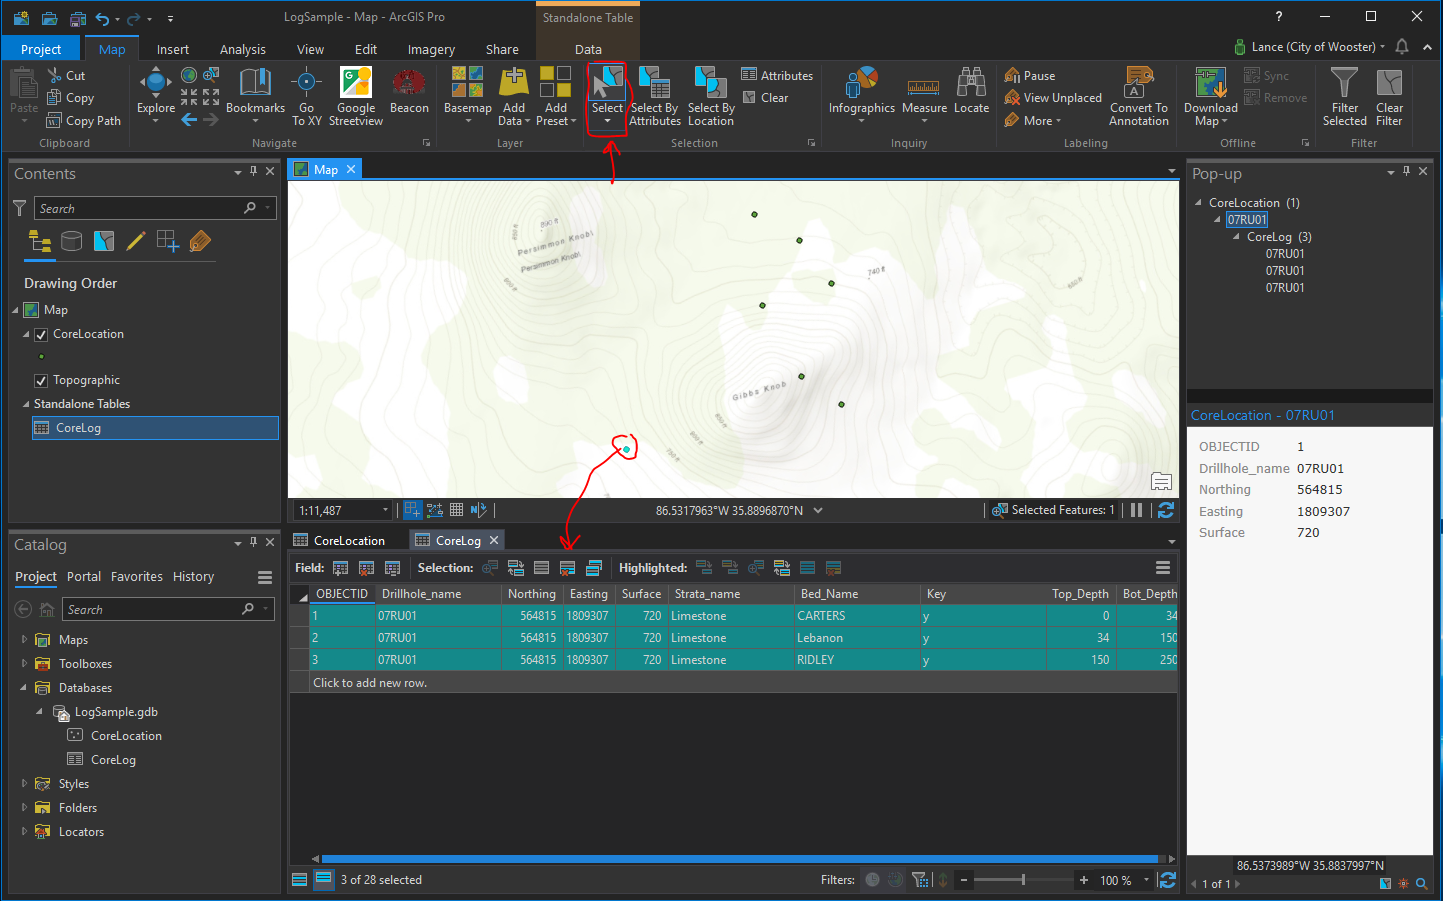
Select another location and the CoreLog attribute table will automatically adjust to the new selected location. There may ne a slight delay as the program filters.
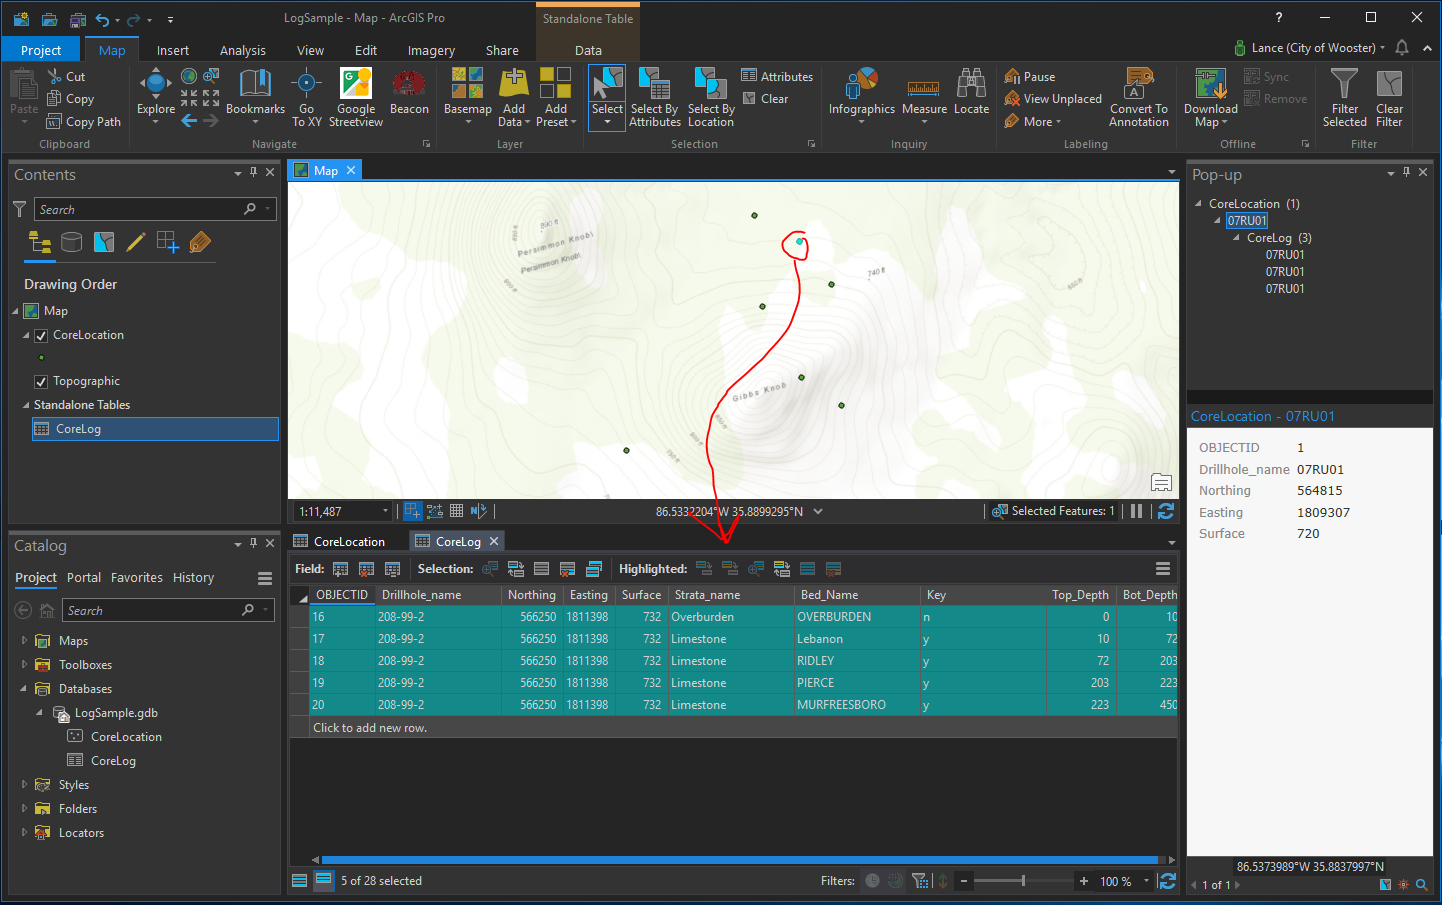
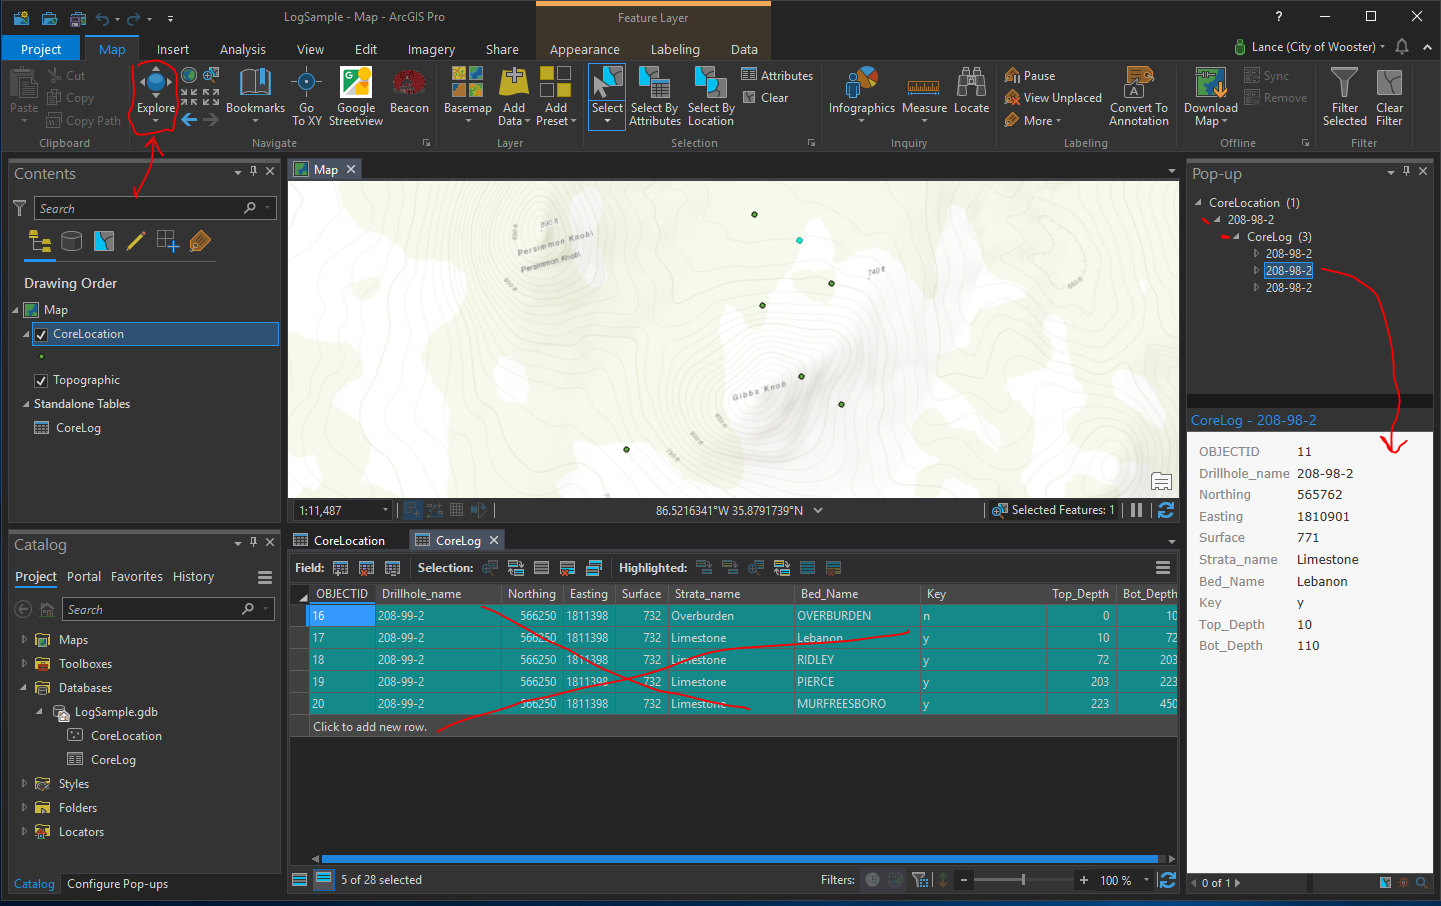
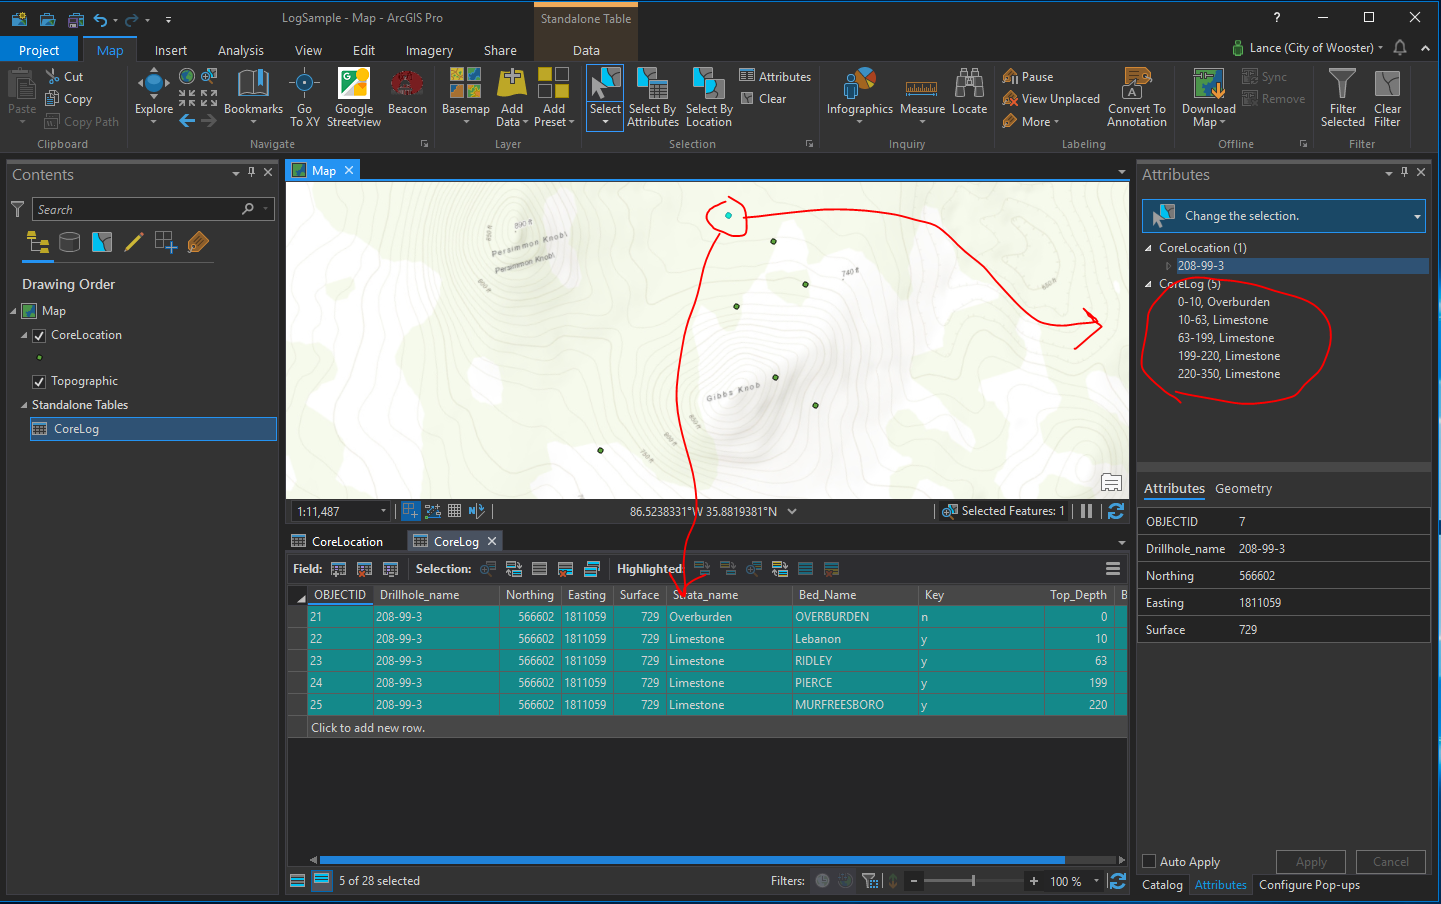
😎 Another way to view the related data is to use the Explorer tool. Go to the Map ribbon and select the explorer tool. Click on one of the core locations in the map and you will see the information show in the pop-up windows. You can drill down through the Pop-up data to see the related dat by clicking the arrow next to the listed info. Unfortunately the attribute table does not update using the Explorer tool.
9) To get the best of both worlds, go back to using the Select tool as in #7 above but this time also open your attributes window (not the table - the window) by clicking on "Attributes" on the Map or Edit ribbon. When you select a core location point in your map it will not only update the attribute table display but the attribute window as well. You can even edit the data in this window or the main table.
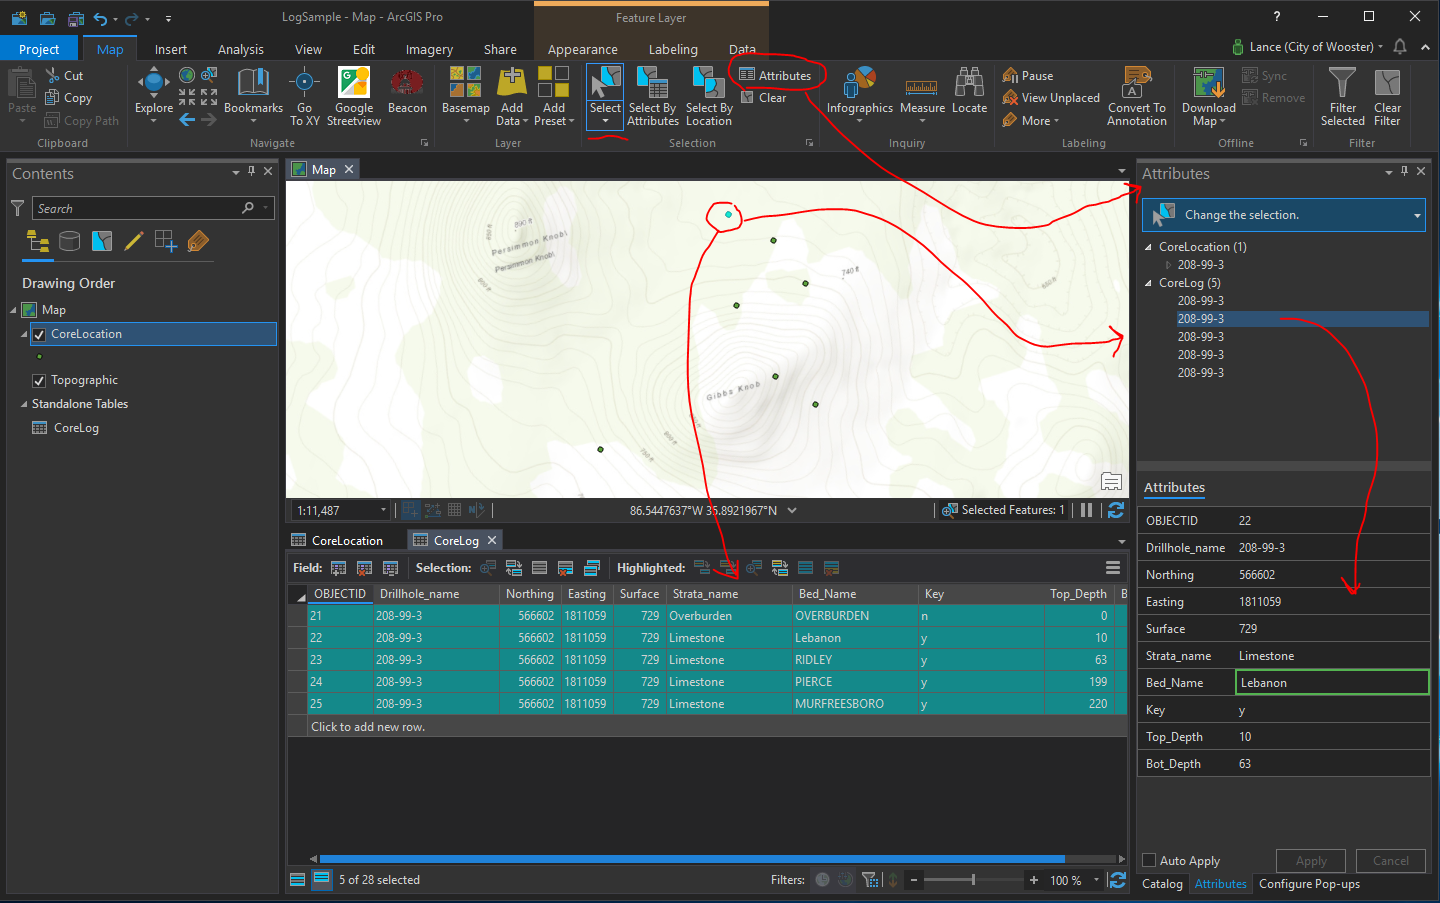
10) One more tip then I will stop so I do not overload you totally. In your Contents windows right click on your CoreLog Table and select Properties. Navigate to Display then click on the "Set an Expression" button next to the Display field option.
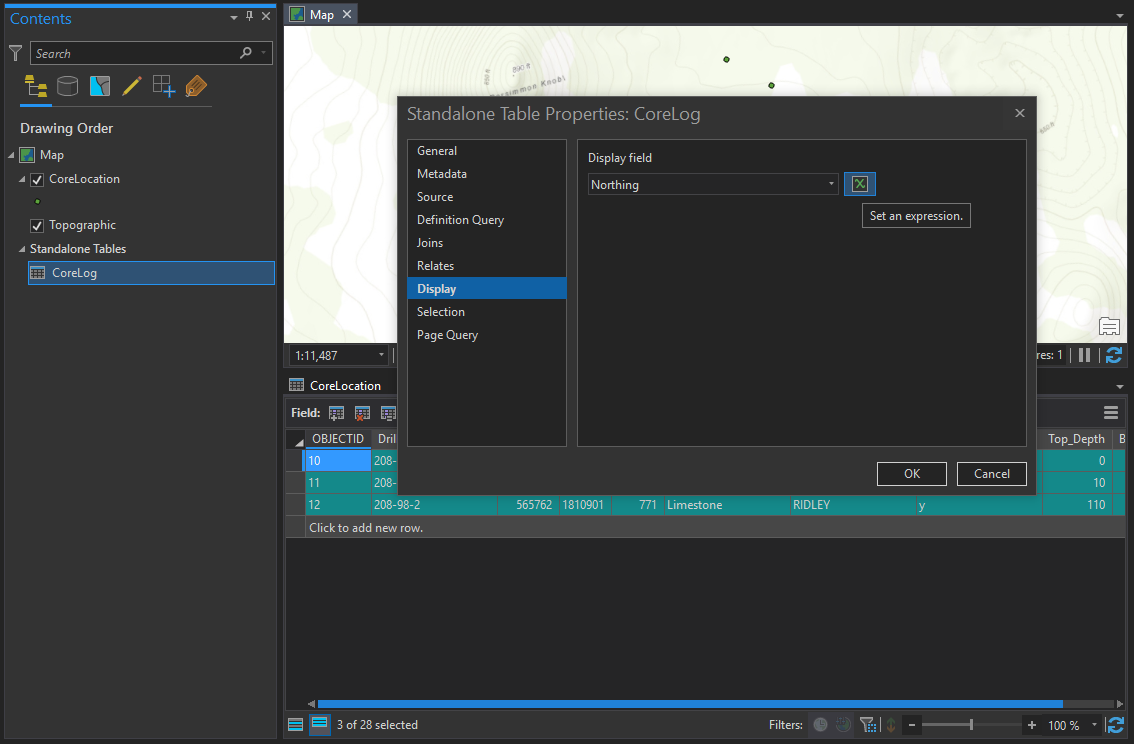
Once the Expression Builder displays enter something along the following to customize the Display Field. This is in Arcade scripting language
var depth = $feature.Top_Depth +"-"+ $feature.Bot_Depth;
Concatenate([$feature.Strata_name, depth],", ");The Attribute Window will now display the depth range and strata name rather then the drill hole name for the core log data. This is a little more useful and fully customizable.
I hope this answers your question and you can work through the process. Working with relates takes a little getting use to as you cannot directly see the data. You can also create a customized Pop-up to display the information in ArcGIS Pro or even AGOL. Information is available at Customize pop-ups | ArcGIS Pro. However, that is a question and an answer in itself.
I will send you back a ZIP file containing the ArcGIS Pro project I just build using your data sample.
Have a great evening/day