- Home
- :
- All Communities
- :
- Products
- :
- ArcGIS Pro
- :
- ArcGIS Pro Questions
- :
- HTML coding
- Subscribe to RSS Feed
- Mark Topic as New
- Mark Topic as Read
- Float this Topic for Current User
- Bookmark
- Subscribe
- Mute
- Printer Friendly Page
HTML coding
- Mark as New
- Bookmark
- Subscribe
- Mute
- Subscribe to RSS Feed
- Permalink
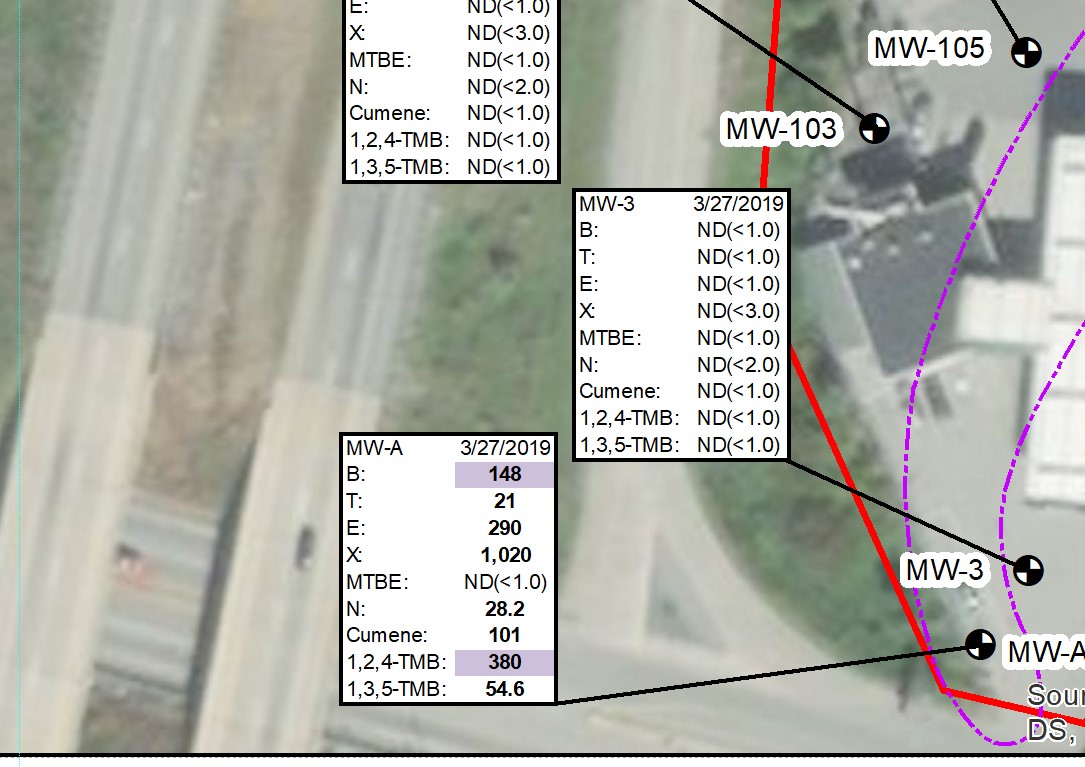
My question relates to HTML coding. I make a lot of maps that show the chemical makeup of groundwater samples. In Desktop, I copy cells from an excel table and paste it as a graphic in an mxd. Generally, the graphic has 2 columns. The left column is the chemical abbreviation and the right column is a number. If the number exceeds a specific value, I make the number bold and sometimes highlight it. I'm trying to figure out how to include the HTML language in the excel table and then join the table to my feature class. Once joined, I will use the label feature and adjust as necessary. Attached is an example of what the final product needs to look like. Does anyone have any examples or thoughts?
- Mark as New
- Bookmark
- Subscribe
- Mute
- Subscribe to RSS Feed
- Permalink
If you can clarify for me a bit, perhaps I can help you. Are you wanting to embed the HTML in your Excel? Are you trying to highlight and/or bold the content of the cell using HTML?
- Mark as New
- Bookmark
- Subscribe
- Mute
- Subscribe to RSS Feed
- Permalink
Chris, I would like to add the HTML coding within each highlighted/bolded cell. That way, when I join the excel table to my feature class and then label each point location, the HTML will make the text appear with the bold/highlight. For example, what little I know about HTML....If I enter "<1.0" in a cell, it will display "<1.0" on my map after I chose the label field that contains that coding.
FYI...I'm trying to learn HTML coding since Pro does not support pasting graphics onto a map.
- Mark as New
- Bookmark
- Subscribe
- Mute
- Subscribe to RSS Feed
- Permalink
Ok, so in your cells you will use the CONCAT function to string together your HTML formatting, like so:
=CONCAT("<b>", some value ,"</b>")
where some value could be text or a reference to another cell in your spreadsheet. You could even get fancy and put conditions around the formatting such that it would only apply if those conditions are met.
Let me know if that is what you are looking for.
- Mark as New
- Bookmark
- Subscribe
- Mute
- Subscribe to RSS Feed
- Permalink
Chris, Do you know what the HTML code would be to highlight the cell? Is that even possible since it's technically not a cell? Please refer to the pdf I attached to the original post. I have the <bol>, <clr>, <fnt>, etc... nailed down. Just highlighting an entire cell has me baffled. I very much appreciate you help!
- Mark as New
- Bookmark
- Subscribe
- Mute
- Subscribe to RSS Feed
- Permalink
Ah for that bit you actually need to add a little bit of CSS styling into the tag
=CONCAT("<b style=""background-color:powderblue;"">", some value ,"</b>")
The tricky bit here is to make sure that you double your double quotes for the style portion. Normally you wouldn't need to do that, but since you are having Excel create a literal string that has quotes in it, you have to escape them.
- Mark as New
- Bookmark
- Subscribe
- Mute
- Subscribe to RSS Feed
- Permalink
It looks like the code is not being interpreted and is being output as a literal text string. I've not messed with HTML inside Pro, I was just going off my web development background. Let me experiment a bit and see if I can get it to work.
- Mark as New
- Bookmark
- Subscribe
- Mute
- Subscribe to RSS Feed
- Permalink
I apologize, I have led you astray. I should have thought about your OP more carefully before I answered.
The formatting you want to accomplish needs to be done as a label expression. You can do all sorts of neat things with it, but idea would go like this in Arcade:
"<CLR red="255">" + $feature.OBJECTID + "</CLR>"
This bit of code would make the field (objectid) I pulled from my data set red. You can see the full list of text formatting tags and how they work here: https://pro.arcgis.com/en/pro-app/help/mapping/text/text-formatting-tags.htm
You can also use it to build up conditions so that IF a value is greater that x, do this IF NOT do that.
All that is covered here: https://pro.arcgis.com/en/pro-app/help/mapping/text/specify-text-for-labels.htm
Again I'm sorry for sending you down the wrong path initially, hopefully this will get you back on the right one.