- Home
- :
- All Communities
- :
- Products
- :
- ArcGIS Pro
- :
- ArcGIS Pro Questions
- :
- Re: Enable scale based sizing not reflected in web...
- Subscribe to RSS Feed
- Mark Topic as New
- Mark Topic as Read
- Float this Topic for Current User
- Bookmark
- Subscribe
- Mute
- Printer Friendly Page
Enable scale based sizing not reflected in web map
- Mark as New
- Bookmark
- Subscribe
- Mute
- Subscribe to RSS Feed
- Permalink
I am working in Pro and enabled scale based sizing for the Symbology of numerous features. When published to a web map this scaling was not sticking.
Any thoughts how I can fix this?
Many thanks!
- Mark as New
- Bookmark
- Subscribe
- Mute
- Subscribe to RSS Feed
- Permalink
Are you publishing a web map to ArcGIS Online? If you have Enterprise, and publish the map as a map image layer, I think the scale-dependent symbology would stick.
- Mark as New
- Bookmark
- Subscribe
- Mute
- Subscribe to RSS Feed
- Permalink
I agree with what Kory said. Otherwise, just publishing a hosted feature service in AGOL will reduce much of the symbology to make it more web-optimized. I wish AGOL would accept more 'custom' symbology like this but there has to be a cut-off or trade-off somewhere.
- Mark as New
- Bookmark
- Subscribe
- Mute
- Subscribe to RSS Feed
- Permalink
I am sharing my Pro map as a Web Map. Each feature class has a pop-up and yes, they do have custom icons.
- Mark as New
- Bookmark
- Subscribe
- Mute
- Subscribe to RSS Feed
- Permalink
Hi Brian,
I am facing the similar issue ? Please let me know if you find any resolution to fix this. When published to a web map this scaling was not reflecting in web map.
- Mark as New
- Bookmark
- Subscribe
- Mute
- Subscribe to RSS Feed
- Permalink
As mentioned above, you would have to publish a map image layer rather than a web feature layer to maintain the display...Map image layer—ArcGIS Pro | ArcGIS Desktop
- Mark as New
- Bookmark
- Subscribe
- Mute
- Subscribe to RSS Feed
- Permalink
When publish as a web layer , I can't see the scale based sizing , means boundary thicknesses is same at all zoom levels.
But in ArcGIS pro I can see thickness changes as per scale based sizing.
- Mark as New
- Bookmark
- Subscribe
- Mute
- Subscribe to RSS Feed
- Permalink
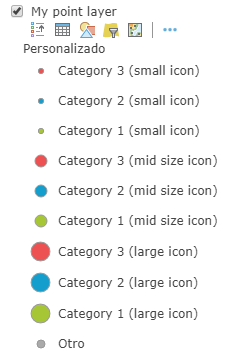
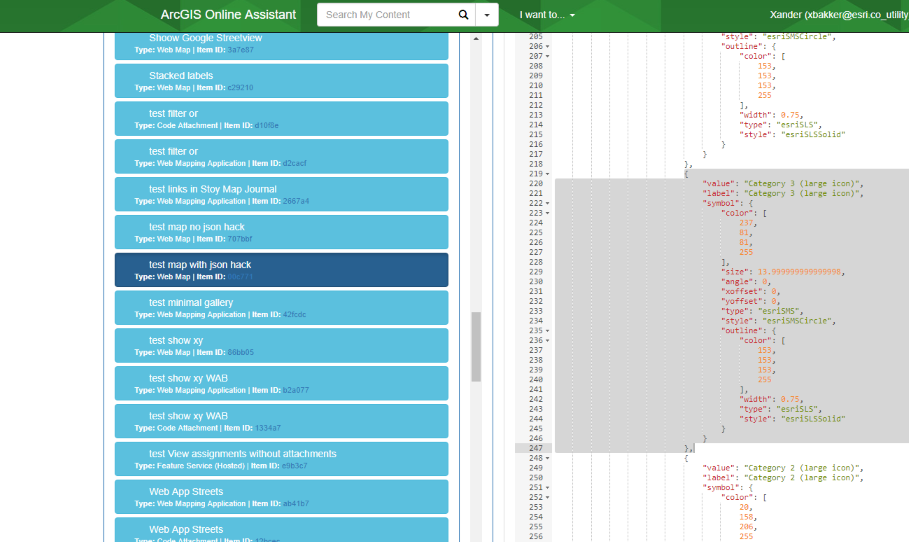
There are ways to mimic scale dependent symbology in a web map using Arcade, but I really don't recommend you to walk that path since it requires a json hack using ArcGIS Online Assistant and you will have a legend that contains all the values, like this:
This is the result at different scales:
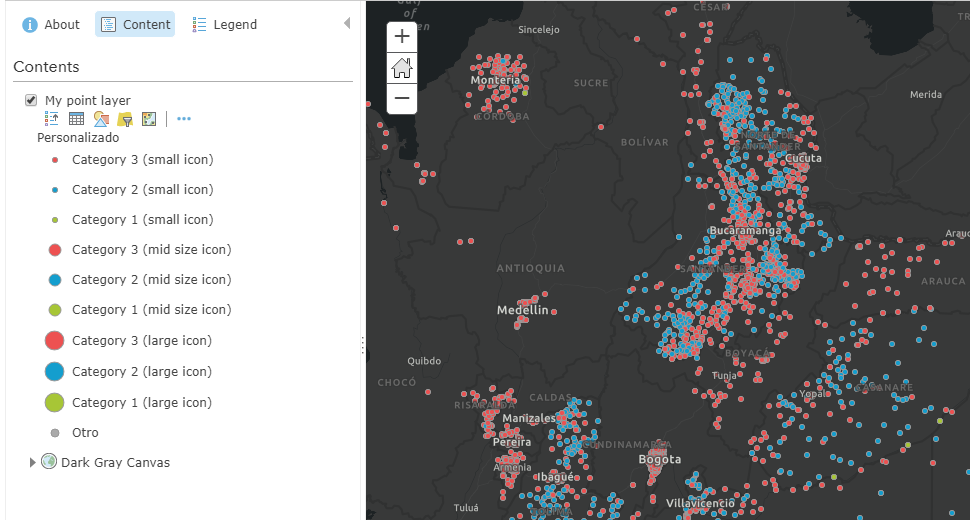
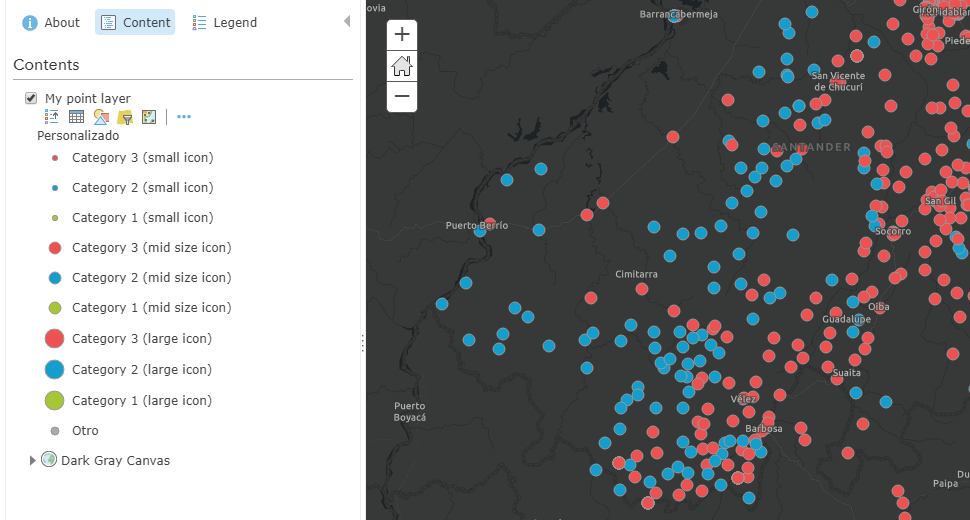
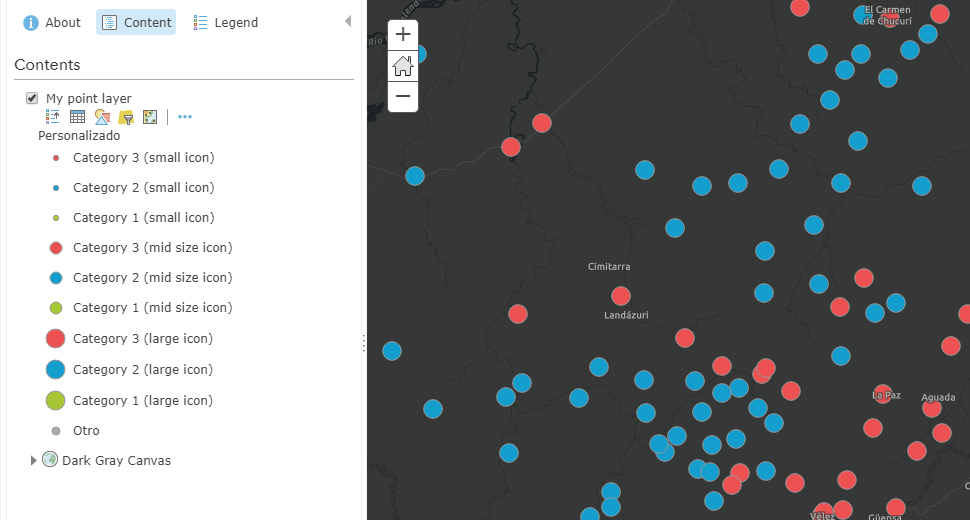
As you can see 3 different symbol sizes at different scales. This can be achieved using Arcade and the "$view.scale":
var val = $feature.MyCategoryField;
if ($view.scale < 1000000) {
val += " (large icon)";
} else if ($view.scale < 2500000) {
val += " (mid size icon)";
} else {
val += " (small icon)";
}
return valThe challenge is when you want to define the symbols. The expression will read the values and populate the legend with these resulting values. However, since the view scale is static at the moment of defining the symbols, it will only find those values generated for the current scale and not for all scales.
To be able to define the symbols, one has to "hack the" json including the symbols for those scales that are different from the current view scale, like for instance this:
{
"value": "Category 3 (large icon)",
"label": "Category 3 (large icon)",
"symbol": {
"color": [
237,
81,
81,
255
],
"size": 13.999999999999998,
"angle": 0,
"xoffset": 0,
"yoffset": 0,
"type": "esriSMS",
"style": "esriSMSCircle",
"outline": {
"color": [
153,
153,
153,
255
],
"width": 0.75,
"type": "esriSLS",
"style": "esriSLSSolid"
}
}
},
I will be great to be able to publish the multi-scale symbology from ArcGIS Pro.
- Mark as New
- Bookmark
- Subscribe
- Mute
- Subscribe to RSS Feed
- Permalink
This is a very intriguing solution using Arcade expressions. I appreciate the walk-through of how you created the categories and scaling.
I agree though that it would be helpful to have the ability to publish out the scale-based symbology directly from ArcGIS Pro. Especially in an Enterprise environment, a hack to the web map's JSON file is not an ideal solution. Are there plans to bring this capability to ArcGIS Enterprise?
If not, I can create a post to ArcGIS Ideas for this functionality. Having different scaling for markers when they are at a global scale vs at a street level view is key for properly visualizing out data on a Dashboard.