Turn on suggestions
Auto-suggest helps you quickly narrow down your search results by suggesting possible matches as you type.
Cancel
- Home
- :
- All Communities
- :
- Products
- :
- ArcGIS Pro
- :
- ArcGIS Pro Questions
- :
- Create displacement time Series from point Shape ...
Options
- Subscribe to RSS Feed
- Mark Topic as New
- Mark Topic as Read
- Float this Topic for Current User
- Bookmark
- Subscribe
- Mute
- Printer Friendly Page
Create displacement time Series from point Shape Files
Subscribe
877
0
04-28-2022 06:35 AM
04-28-2022
06:35 AM
- Mark as New
- Bookmark
- Subscribe
- Mute
- Subscribe to RSS Feed
- Permalink
Dear community,
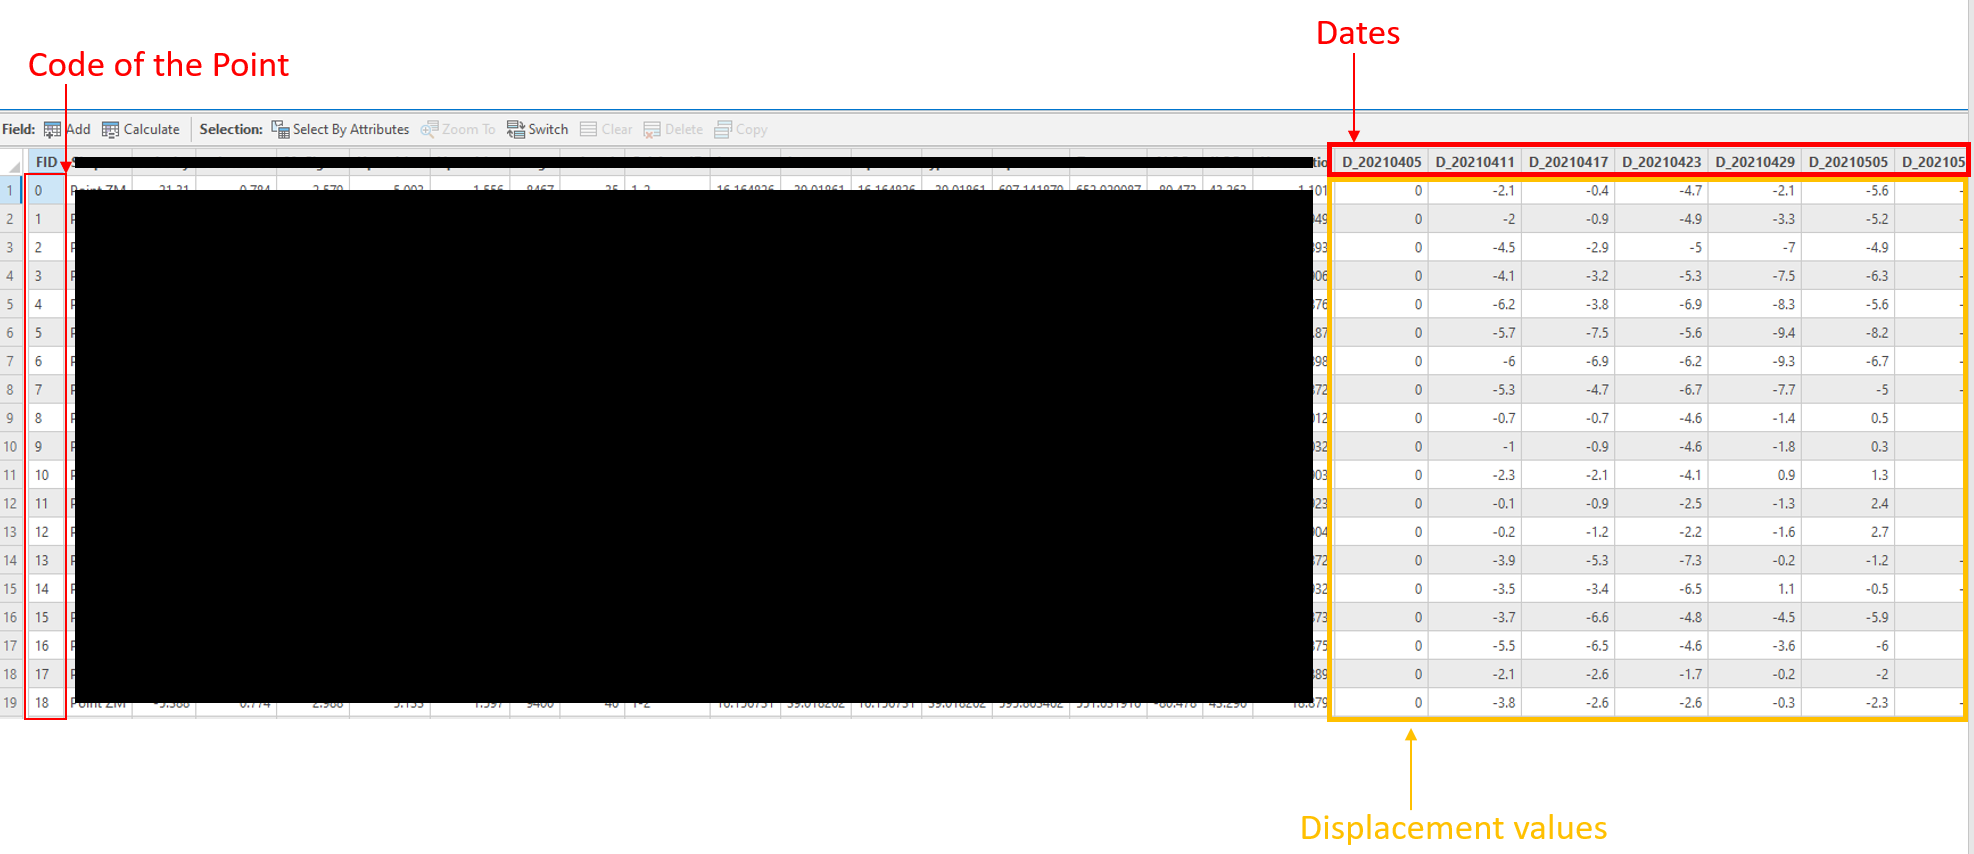
I have a shape file made of points, each point has a code and for each point code I have his evolution of displacement in time. Here below I paste a screenshot of the structure of my Attribute Table (also attached):

I would like to create a chart where on the X axis I have the dates and on the Y axis the Displacement values, each different time series will be related to a specific Point code. I've made several attempts with the ''Create Chart'' tool but none of the chart suit my needs.
(I am running ArcGIS Pro 2.9.32739)
What do you suggest? I attach the attribute table.
Thank you in advance for your time!
Michele
0 Replies