- Home
- :
- All Communities
- :
- Products
- :
- ArcGIS Pro
- :
- ArcGIS Pro Questions
- :
- Re: Aggregate point features to lower resolution a...
- Subscribe to RSS Feed
- Mark Topic as New
- Mark Topic as Read
- Float this Topic for Current User
- Bookmark
- Subscribe
- Mute
- Printer Friendly Page
Aggregate point features to lower resolution and average them
- Mark as New
- Bookmark
- Subscribe
- Mute
- Subscribe to RSS Feed
- Permalink
Hi community!
I want to create a line feature representing the erosion projection for 2100 for Schouwen-Duiveland (province Zeeland, in the Netherlands).
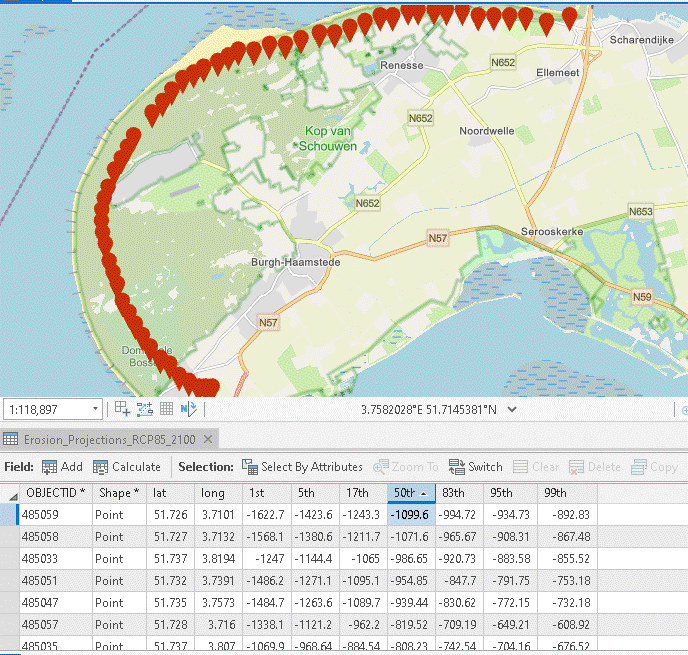
I have already the data which consists on a set of points measured every 200m, each representing the projections for the shoreline in percentiles (ex. -120m from shoreline). I want to aggregate this data in lower resolution (let’s say every 100 km), average them on the median and create the line. See screen capture to visualize the table and point features.
How can I interpolate the data without create a continuous layer? Or if someone has another solution, I would love to hear it!
Thanks in advance!
Isabelle B
Solved! Go to Solution.
- Mark as New
- Bookmark
- Subscribe
- Mute
- Subscribe to RSS Feed
- Permalink
@JayantaPoddar could you follow up on your initial idea
... sort of retired...
- Mark as New
- Bookmark
- Subscribe
- Mute
- Subscribe to RSS Feed
- Permalink
...to maybe add more accuracy...
interpolating values won't accomplish this, you can't improve on the coarseness and inaccuracies inherent in the original data. I would simply discuss what is there and the limitations imposed by the data you have.
... sort of retired...
- Mark as New
- Bookmark
- Subscribe
- Mute
- Subscribe to RSS Feed
- Permalink
Ok. Thanks very much for your help. I will do that
- « Previous
-
- 1
- 2
- Next »
- « Previous
-
- 1
- 2
- Next »