- Home
- :
- All Communities
- :
- Products
- :
- ArcGIS Online
- :
- ArcGIS Online Questions
- :
- Re: Layers not Drawing Completely
- Subscribe to RSS Feed
- Mark Topic as New
- Mark Topic as Read
- Float this Topic for Current User
- Bookmark
- Subscribe
- Mute
- Printer Friendly Page
Layers not Drawing Completely
- Mark as New
- Bookmark
- Subscribe
- Mute
- Subscribe to RSS Feed
- Permalink
Hello,
I am still experiencing the small, persistent orange circle of annoyance. Nearly every map I pull up (all hosted on AGOL) features this little orange monstrosity in the lower corner no matter how many features are in the feature layer (20 vs 6,000).
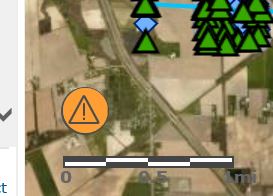
I've noticed this since the last update and wondered if anyone had any ideas or if anyone else was experiencing the same thing.
The really irrigating thing is that even though it says it can't draw all oft he features, it does.....Until you start panning and zooming. Then the map gets really slow and unresponsive and it just stops drawing features all together. All of this is very intermittent...except for the orange circle.
Any insight is appreciated! I had asked on another thread but hadn't received any substantial answers.
- Mark as New
- Bookmark
- Subscribe
- Mute
- Subscribe to RSS Feed
- Permalink
Hi Tiffany,
Can you share the URL to the misbehaving service? Does it act any differently in a different browser? I might try clearing your browsing history. I've gotten some funky behavior in AGOL that was fixed by doing that.
Finally, can you hit Control + Shift + I to bring up the developer console, go to the Console tab, and see if there are any browser errors? That might give some more troubleshooting info.
Micah
- Mark as New
- Bookmark
- Subscribe
- Mute
- Subscribe to RSS Feed
- Permalink
Well, It's at least 100 different feature layers...so that would be difficult to share. But switching to Edge seems to have worked for now.
Thank you for your help!
- Mark as New
- Bookmark
- Subscribe
- Mute
- Subscribe to RSS Feed
- Permalink
Hi Tiffany,
As you've already said, your map has at least 100 different feature layers - that's a lot of data.
ArcGIS Online count the total number of features that is going to be drawn on the map (browser) with its current extent. If the total number is over a certain amount, then the orange warning message will show up.
Due to the limitation of the browser, if there're too many features drawn on the map, it will slow down other operations like panning and zooming as you've already noticed. That is the user experience we're trying to avoid.
So it doesn't depends on what layer is not drawn, it depends one how many features you already on the map.
So the next thing is to consider about mapping efficiency again. When you zoomed out, is displaying that many features (or that many layers) at the same time really necessary?
You may want to set visible scale range for each layer?
Set visible range—ArcGIS Online Help | ArcGIS
Or set a filter to show less features on the map?
Apply filters—ArcGIS Online Help | ArcGIS
Or if your main data is point, mind try our new style of point layer?
Configure clustering—ArcGIS Online Help | ArcGIS
Thanks,
Xiaolong
- Mark as New
- Bookmark
- Subscribe
- Mute
- Subscribe to RSS Feed
- Permalink
Xiaolong,
Thank you for the reminder, it's always good to have a refresher.
However, I should have been more clear, I have around 100 feature layers hosted on AGOL, they are not on the same map together though. At most there are 4 to 5 layers on any given map. The largest individual feature layer I have has over 6,000 features and the smallest has about 20.
The issue that I was having was that no matter what map (combination of layers large and small) I pulled up it was still showing the 'failed to draw' warning even if it was just the 20 item feature layer on a base map by itself.
I have since switched from using Internet Explorer to Edge and it hasn't happened again so far.
Thanks again!
- Mark as New
- Bookmark
- Subscribe
- Mute
- Subscribe to RSS Feed
- Permalink
Hey Tiffany,
Try monitoring the requests from your web map to your services. Here is a blog about the layer drawing error:https://community.esri.com/community/gis/web-gis/arcgisonline/blog/2017/10/17/so-you-want-to-display....
If it seems like a browser issue, check the service to see if there are any issues with its response or mixed content.
-Kelly
- Mark as New
- Bookmark
- Subscribe
- Mute
- Subscribe to RSS Feed
- Permalink
Kelly Gerrow - I know this is old but can you tell me how to monitor requests from web maps to services?
Thanks
- Mark as New
- Bookmark
- Subscribe
- Mute
- Subscribe to RSS Feed
- Permalink
No worries Mark, check out these blogs about monitoring requests:
As these blogs were written a while ago, you'll notice that some requests may have a format of pbf instead of json in the request, you can easily swap these values to see JSON which is human readable.
-Kelly
- Mark as New
- Bookmark
- Subscribe
- Mute
- Subscribe to RSS Feed
- Permalink
Hello,
Was anyone able to figure this out? We've noticed the same thing recently, and it's beginning to be a problem enterprise-wide. For example, we've got a feature layer that contains only 142 points in one feature class and we're getting the "orange circle of annoyance." It would be helpful to understand what is causing this so we can make adjustments where needed. Further, this occurs in both IE 11 and Chrome. Though we have one service where it only shows up in IE.

Thanks.
- Mark as New
- Bookmark
- Subscribe
- Mute
- Subscribe to RSS Feed
- Permalink
The issue went away for us initially when we switched from IE to Edge....but alas, now it happens periodically. It is less frequent for us here in Edge than Explorer but it still persists.
Haven't found a definitive answer yet.