- Home
- :
- All Communities
- :
- Products
- :
- ArcGIS Online
- :
- ArcGIS Online Questions
- :
- Re: How to get attribute with last date modified f...
- Subscribe to RSS Feed
- Mark Topic as New
- Mark Topic as Read
- Float this Topic for Current User
- Bookmark
- Subscribe
- Mute
- Printer Friendly Page
How to get attribute with last date modified from related table using Arcade
- Mark as New
- Bookmark
- Subscribe
- Mute
- Subscribe to RSS Feed
- Permalink
Hello all,
I'm pretty new to Arcade and I'm having problems. I believe I need to be using FeatureSets in Arcade.
I have a hosted feature layer with several related tables, some of which are 1:M. In the CIP_Test pop-up, for the 1:M related tables, I only need to show the data from the rows with the latest "Date Modified".
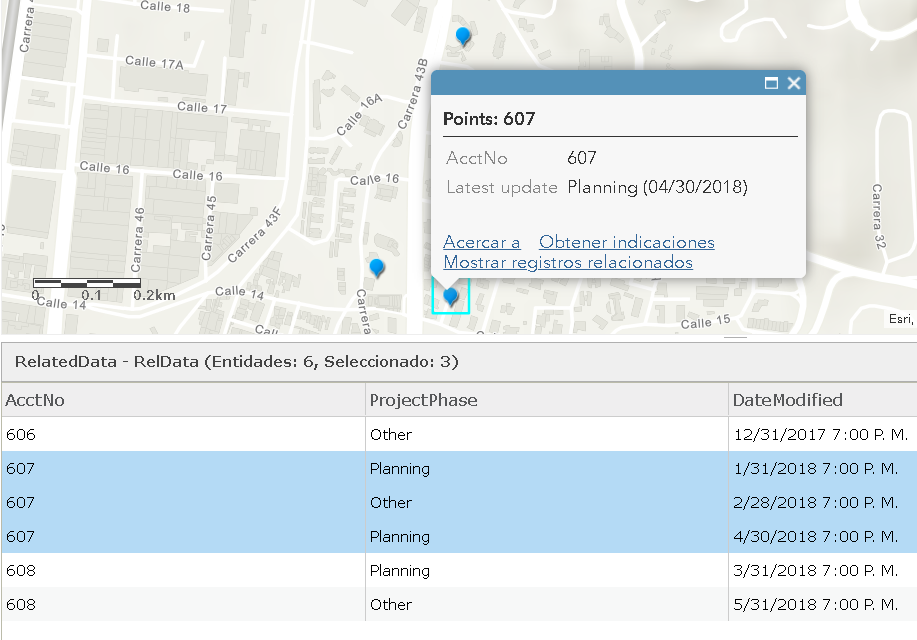
I've attached a screenshot of the related table. Where there are duplicate AcctNo, I only want to show the ProjectPhase (and maybe other fields) for the record that was last modified.
Any suggestions on how to do this are much appreciated! I have gotten nothing but errors in everything I've tried from any forum posts I've found....
- Mark as New
- Bookmark
- Subscribe
- Mute
- Subscribe to RSS Feed
- Permalink
I had posted this same question at the bottom of the "Overlapping Features in Pop-Ups.....FeatureSets with Arcade" blog post and you responded with:
"
Hi
You could probably try something like shown below. Keep in mind that you need to change some field names to match your data. The idea is to get the ID from the current feature and create a filter to get the related project phases. This is sorted descending on the date and you get the first element from the result, which should be the most recent change in project phase.
varyourid=$feature.YourIdField;// change the name of the field vartblphases=FeatureSetByName($map,"CIP Test - Project Phase"); varsql="YourIdField = '"+yourid+"'";// if field is text varrelphases=Filter(tblphases,sql); varcnt=Count(relphases); Console(cnt); varresult=""; if(cnt>0){result="Project phase:"+TextFormatting.NewLine;varcurrentphase=First(OrderBy(relphases,'DateModified DESC'));result+="Date : "+currentphase.DateModified+TextFormatting.NewLine;result+="Phase: "+currentphase.ProjectPhase;returnresult; }else{result="There are no project phases defined"; } returnresult;
If the data is related using a relationshipclass, it can be done in a more easy way."
My question is for this last sentence. I've setup my data now in ArcMap with relationship classes and published it as a feature layer. Can you explain the easy way, please?
Thanks,
Kelly
- Mark as New
- Bookmark
- Subscribe
- Mute
- Subscribe to RSS Feed
- Permalink
Hi Kelly.Doss_DurhamNC ,
Let me create a dummy dataset and test some things out and I will get back to you with an example.
- Mark as New
- Bookmark
- Subscribe
- Mute
- Subscribe to RSS Feed
- Permalink
Hi Kelly Doss ,
Here is an example of what I think you are trying to obtain:

The underlying Arcade expression is:
var relatedrecords = OrderBy(FeatureSetByRelationshipName($feature, "RelData"), "DateModified DES");
var cnt = Count(relatedrecords);
var relatedinfo = "";
if (cnt > 0) {
var info = First(relatedrecords);
relatedinfo = info.ProjectPhase + " (" + Text(ToLocal(info.DateModified), "MM/DD/Y") + ")";
}
return relatedinfo;So, first the related records are obtained using the relationshipclass (ordering the result on DateModified). Then we use the count to know have many related records were found. When there are any, the first record (most recent update) is retrieved and some fields are formatted for presentation.
- Mark as New
- Bookmark
- Subscribe
- Mute
- Subscribe to RSS Feed
- Permalink
Thank you so much for taking the time to help me! I’ll let you know if I have success.
Kelly
- Mark as New
- Bookmark
- Subscribe
- Mute
- Subscribe to RSS Feed
- Permalink
Hello,
I have shared an AGO group with you that has my feature layer in it. As I’ve been researching through Esri documentation and blog posts on how to create the desired dashboard, I’m wondering now if I’ll be able to even get there using the current data schema. So before continuing with doing research, working out attribute expressions, and testing for my popups, I’d like to give you some history and what I’d like to accomplish. I’d appreciate if you can let me know if it’s feasible and what would be needed to make it happen.
Our current Capital Projects viewer that was created many years ago in SQL is here:
http://cip.durhamnc.gov/
In its current state, it hasn’t been possible to have a mapping component because the only geographic information included is a parcel PIN, and that won’t work and is blank for many projects. City management has requested that we create a more updated viewer that includes a map, and would like a dashboard that has charts and graphs as well. Phase 1 of the overall project is creating the viewer using existing data. For the mapping component, I created polygon and point (with many points for multipart polygons) feature classes with the Account Number, then joined and related tables that were exported from the existing SQL database; I tried adding a Query Layer, but it wouldn’t publish.
The feature layer in the group that I shared with you is these polygon and point layers and the related tables. Ideally, I was hoping to make a Capital Projects Operations Dashboard<https://solutions.arcgis.com/local-government/help/capital-project-dashboard/> or use Web AppBuilder with the Dashboard theme. It would include filters for Service Area, Fiscal Year, Completed Projects, etc., the popup panel would include Phase data, and there would be charts for the Expenditure and Financials tables.
Is this even possible with how the data is currently setup? If not, do you have any suggestions on how to properly setup my data schema so that all needed data is in one table? I’ve viewed the feature layer, map, and dashboard included with the Capital Projects Dashboard Solution to see its schema and settings, and, along with your popup arcade expression help, it is greatly helpful for the popups, but not for the expenditure and financial data.
Phase 2 of the overall project is converting to a new system that can be used for all city projects, not just capital projects. My department was going to test drive Aurigo, PPM software and an Esri partner, but that has hit a snag.
Thank you so much for your time. From reading through the blog posts and help requests, you are an incredible asset to the community! I’ve been at my job for a little over a year now, and my whole team is learning all of the new AGO and Portal capabilities on the fly as needed.
Kelly Doss, GISP
GIS Analyst
Technology Solutions Dept.
City of Durham
101 City Hall Plaza
Durham, NC 27701
P 919-560-4122 x33218
F 919-560-4808
Kelly.Doss@durhamnc.gov
- Mark as New
- Bookmark
- Subscribe
- Mute
- Subscribe to RSS Feed
- Permalink
Hi Kelly Doss ,
I tried to open the CIP viewer, but for some reason it won't open. I did not see an invitation in my messages when I entered ArcGIS Online. Can you share a link to your portal/group to see if I have access? I assume that I will be able to see the data there to be able to provide some feedback to the questions you asked.
As far as I understand your data in AGOL is static, since publishing query layers requires ArcGIS Enterprise with access to the SQL database. Also publishing data with joins can generate problems.
Operations Dashboard can provide the tools to visualize the data you have. Using solutions and the proposed data schema for local government can provide a lot of benefits. In case the Capital Project Dashboard does not contain all the features you want, you could consider providing an additional Dashboard to visualize the missing data.
Once I have access to the data, I can have a look at your data and see what is possible, but it might be a good thing to reach out to your local Esri account manager and sit down with him/her and a solution engineer from the local government team to have a better look at what you envision and learn about the options ArcGIS provides. This might be a good time to do that.
- Mark as New
- Bookmark
- Subscribe
- Mute
- Subscribe to RSS Feed
- Permalink
Hello Xander,
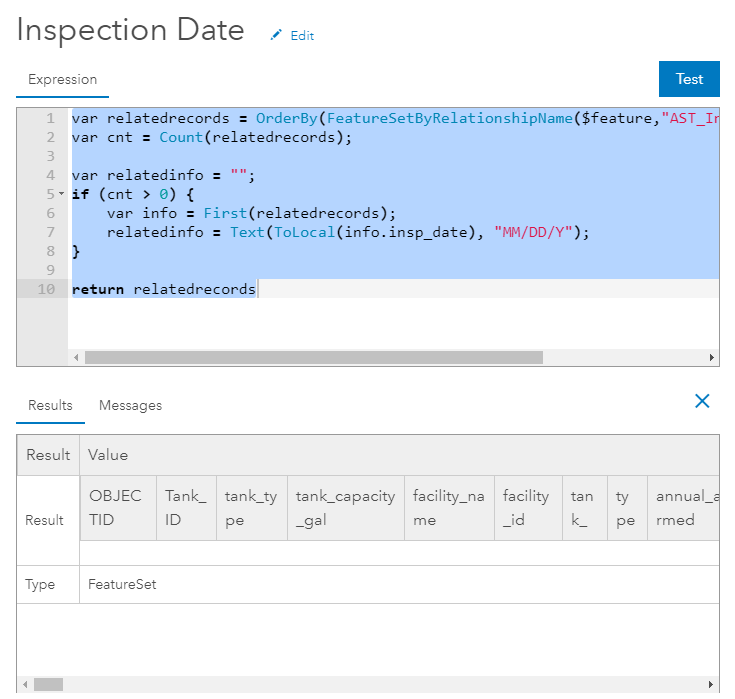
I'm working on a similar project and trying to pull an inspection date out of a related table. My code is as follows:
var relatedrecords = OrderBy(FeatureSetByRelationshipName($feature,"AST_Inspection"), "insp_date");
var cnt = Count(relatedrecords);
var relatedinfo = "";
if (cnt > 0) {
var info = First(relatedrecords);
relatedinfo = Text(ToLocal(info.insp_date), "MM/DD/Y");
}
return relatedrecordsWhen I test it returns results:

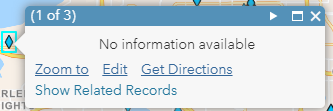
But in the pop up I've inserted the expression, it breaks the entire pop up and says No Information Available.

Where have I gone wrong?
Thanks,
Tim
- Mark as New
- Bookmark
- Subscribe
- Mute
- Subscribe to RSS Feed
- Permalink
Hi Tim Flynn ,
Small change required in the expression. You are returning "relatedrecords" which is a featureset you fetched on line 1 of your expression and you want to return "relatedinfo".
The featureset is shown in the test result, but a featureset cannot be shown in the pop-up. That is the reason.
- Mark as New
- Bookmark
- Subscribe
- Mute
- Subscribe to RSS Feed
- Permalink
Xander, thank you so much! I knew it was something simple.