- Home
- :
- All Communities
- :
- Products
- :
- ArcGIS Online
- :
- ArcGIS Online Questions
- :
- Re: AGOL Usage - dates question
- Subscribe to RSS Feed
- Mark Topic as New
- Mark Topic as Read
- Float this Topic for Current User
- Bookmark
- Subscribe
- Mute
- Printer Friendly Page
- Mark as New
- Bookmark
- Subscribe
- Mute
- Subscribe to RSS Feed
- Permalink
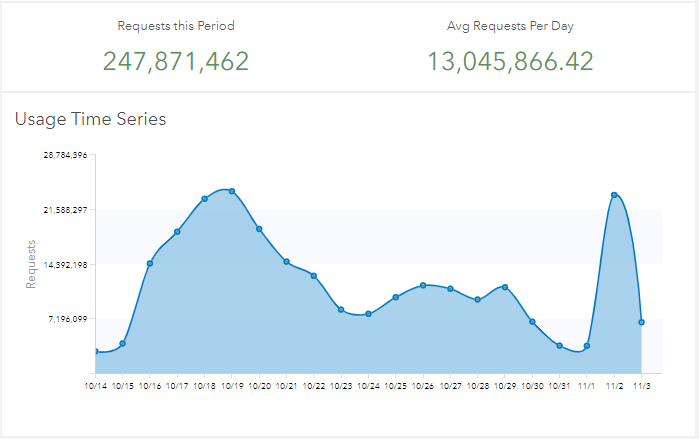
Now that the election is "over", I'm trying to understand the usage statistics for our election Wait Time app (which was a big success). When I look at the Usage Chart, the dates seem odd. Usage appears to peak on Monday 11/2, the day BEFORE the election, when the polls were not even open. This doesn't seem right. I've attached a screen shot showing the usage chart for the hosted AGOL layer that supports our app. Can anyone explain why the usage stats seem to be off by a day? Am I reading the chart wrong? Peter Klingman
Thanks,
Jay
Washoe County GIS
Solved! Go to Solution.
Accepted Solutions
- Mark as New
- Bookmark
- Subscribe
- Mute
- Subscribe to RSS Feed
- Permalink
Hi Jay,
Thanks for the note on this. This chart relies on the /usage request for the item. If you open up developer tools to the Network tab, you can view the response for this request. Likely, the discrepancies seen are due to the usage API querying for requests based on GMT time. This is because time is stored in GMT/UTC in the Online database and for pulling stats on it, conversions introduce computational load. So, it's by design but it's certainly a gotcha to be aware of. Here is an example on my end:
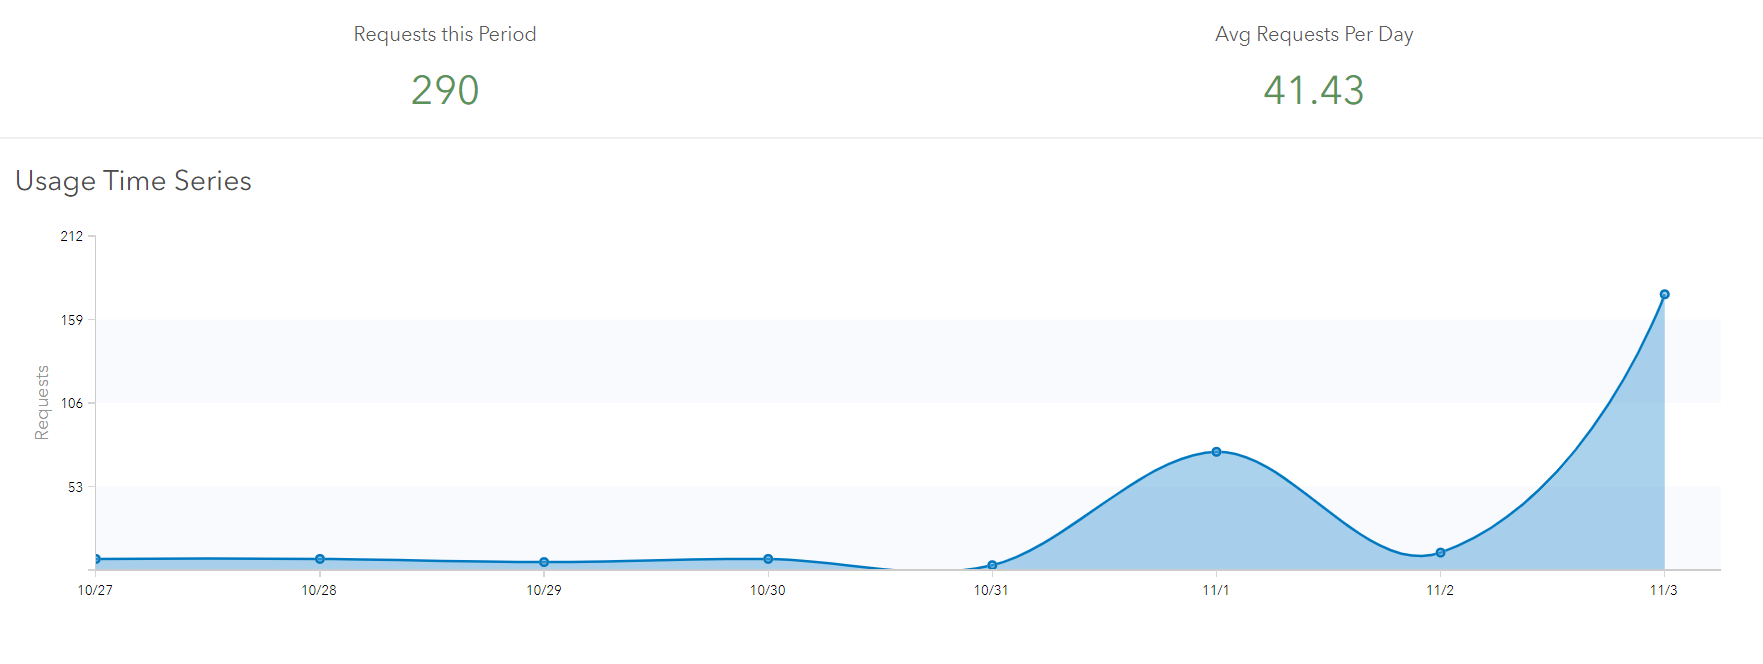
The data that hydrates the chart (found in the /usage response) is:
{
"startTime": 1603843200000,
"endTime": 1604534400000,
"period": "1d",
"data": [{
"etype": "svcusg",
"name": "World_Countries_Pop_and_Annual_Electricity",
"stype": "features",
"num": [["1603843200000", "7"], ["1603929600000", "7"], ["1604016000000", "5"], ["1604102400000", "7"], ["1604188800000", "3"], ["1604275200000", "75"], ["1604361600000", "11"], ["1604448000000", "175"]]
}
]
}Let's take 11/3 on my chart as an example. To arrive at that value, 24 hours before the unix timestamp 1604448000000 are queried for requests. If you convert that timestamp to human readable time, it is GMT: Wednesday, November 4, 2020 12:00:00 AM, but is Tuesday, November 3, 2020 4:00:00 PM in Pacific Time (where I am). So for the Pacific Time Zone, the data pulled for 11/3 is really for between 11/3 at 4pm to 11/2 at 4pm.
Therefore assuming you are in the lower 48 US states somewhere, there could be anywhere from 5-8 hours that are bucketed into the previous day due to the use of GMT/UTC time to pull the usage stats.
I hope this helps,
-Peter
- Mark as New
- Bookmark
- Subscribe
- Mute
- Subscribe to RSS Feed
- Permalink
Hi Jay,
Thanks for the note on this. This chart relies on the /usage request for the item. If you open up developer tools to the Network tab, you can view the response for this request. Likely, the discrepancies seen are due to the usage API querying for requests based on GMT time. This is because time is stored in GMT/UTC in the Online database and for pulling stats on it, conversions introduce computational load. So, it's by design but it's certainly a gotcha to be aware of. Here is an example on my end:
The data that hydrates the chart (found in the /usage response) is:
{
"startTime": 1603843200000,
"endTime": 1604534400000,
"period": "1d",
"data": [{
"etype": "svcusg",
"name": "World_Countries_Pop_and_Annual_Electricity",
"stype": "features",
"num": [["1603843200000", "7"], ["1603929600000", "7"], ["1604016000000", "5"], ["1604102400000", "7"], ["1604188800000", "3"], ["1604275200000", "75"], ["1604361600000", "11"], ["1604448000000", "175"]]
}
]
}Let's take 11/3 on my chart as an example. To arrive at that value, 24 hours before the unix timestamp 1604448000000 are queried for requests. If you convert that timestamp to human readable time, it is GMT: Wednesday, November 4, 2020 12:00:00 AM, but is Tuesday, November 3, 2020 4:00:00 PM in Pacific Time (where I am). So for the Pacific Time Zone, the data pulled for 11/3 is really for between 11/3 at 4pm to 11/2 at 4pm.
Therefore assuming you are in the lower 48 US states somewhere, there could be anywhere from 5-8 hours that are bucketed into the previous day due to the use of GMT/UTC time to pull the usage stats.
I hope this helps,
-Peter
- Mark as New
- Bookmark
- Subscribe
- Mute
- Subscribe to RSS Feed
- Permalink
Thanks for the explanation Peter. I figured it must be related to that darned UTC.
There are plenty of comments on GeoNet about how we all wish the default usage reports were a bit better. Guess I'll go find a related Idea to vote up. Gary Zaepfel Quinn Korbulic
Washoe County GIS
- Mark as New
- Bookmark
- Subscribe
- Mute
- Subscribe to RSS Feed
- Permalink
Thanks Jay - happy to explain it and we appreciate the ideas and feedback on the reports/usage stats. Also I forgot to mention in my first post kudos on the successful Wait Time app! UTC aside that is a lot of usage.
Have a good weekend,
-Peter