Select to view content in your preferred language

Sentinel-2 - More Than Meets the Eye

3440
12
05-30-2018 10:01 AM
TamaraGrant1
Frequent Contributor
1 12 3,440

by Robert Waterman

Welcome to the ArcGIS Living Atlas of the World

Every day we take in visual cues and make observations of the world around us. In many cases, we take the things we see to be self-evident, that they simply are as we perceive them to be. Other times, we more closely analyze and interrogate things that appear less familiar. Sometimes, just changing our visual perspective can offer additional illumination and enlightenment.

Taking a step closer to understanding our Earth, through a wide range of visual and analytical perspectives, Esri is releasing Sentinel-2 Image Services to all Esri users. Those responsible for crop management, understanding land cover change, energy exploration, natural disaster planning and mitigation, and many more, now have a powerful new ally.

Sentinel-2 is now part of the ArcGIS Living Atlas of the World. The ArcGIS Living Atlas of the World is the foremost collection of geographic information from around the globe. Esri’s beta Sentinel-2 image service, powered by ArcGIS Image Server, includes daily updates, all Sentinel-2 imagery going back 14-months, and includes 13 bands of information. Image analysis can be applied to create image indices that show properties such as vegetation health or soil moisture as well as quantifying changes over time.

Some intriguing examples and use cases

Sentinel-2 derived crop health and water content to monitor and manage our world’s agriculture.

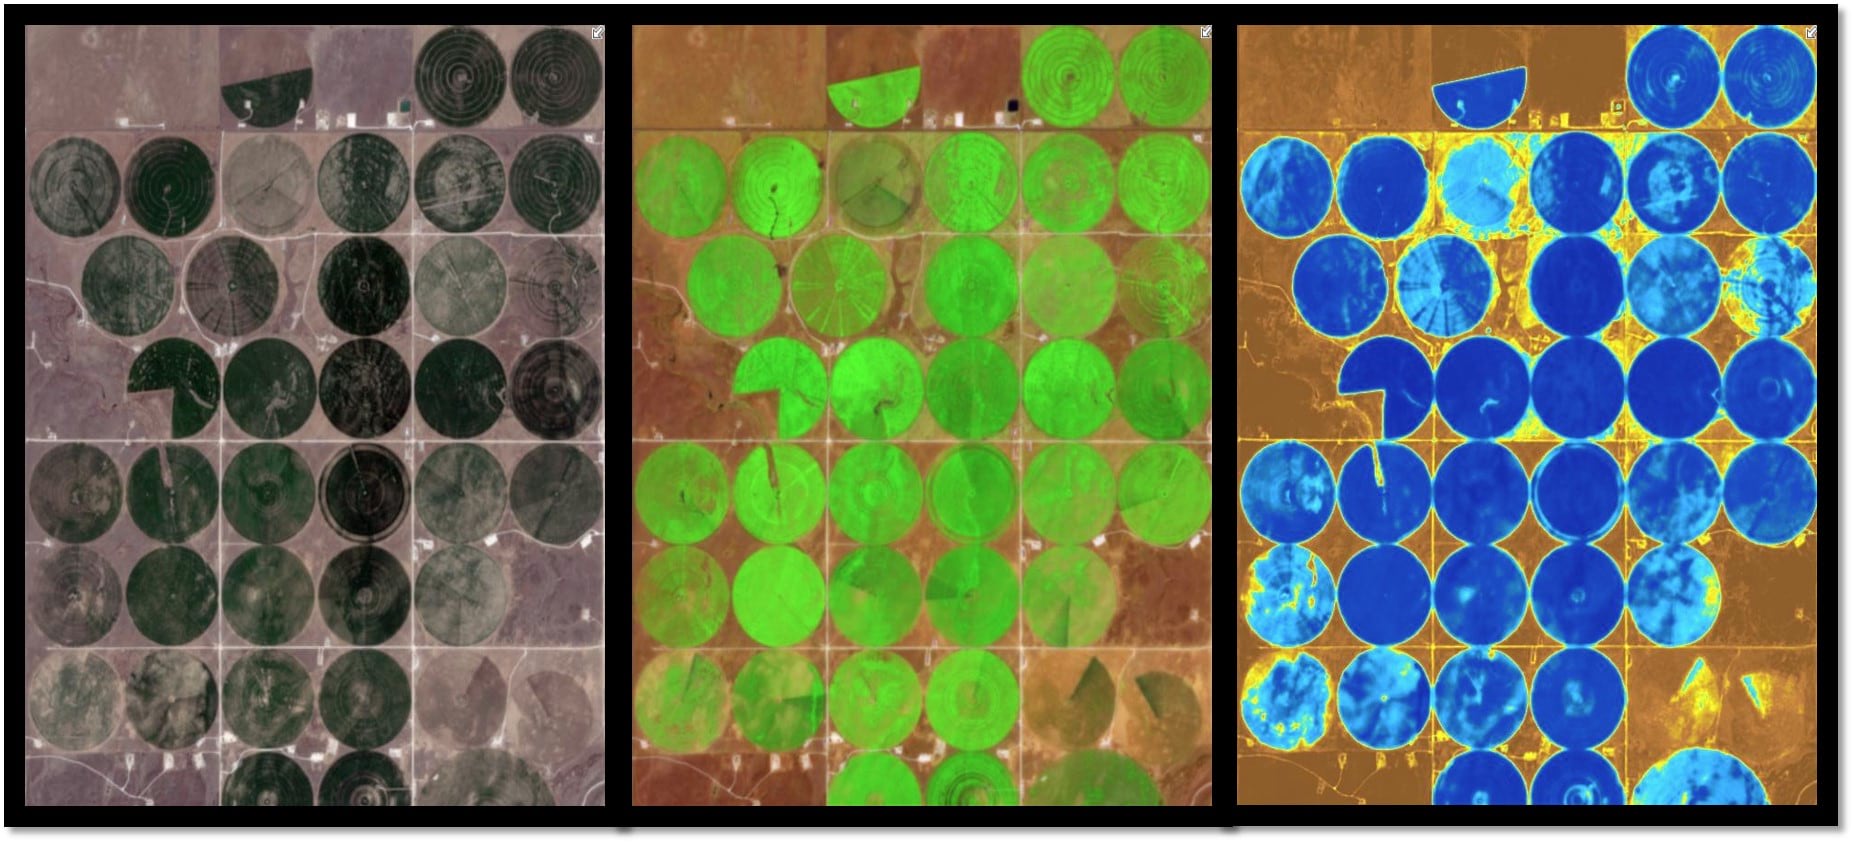
This example shows agricultural fields in various Sentinel-2 band combinations: Natural Color (left) displays the optical wavelengths our eyes naturally detect, Short Wave Infrared Vegetation (Middle) showing the most vigorous vegetation in bright green, and a Water Moisture Index (Right) with the highest moisture levels shown in blue.

Heat signatures used to identify burning oil and natural gas wells and manage carbon emissions.

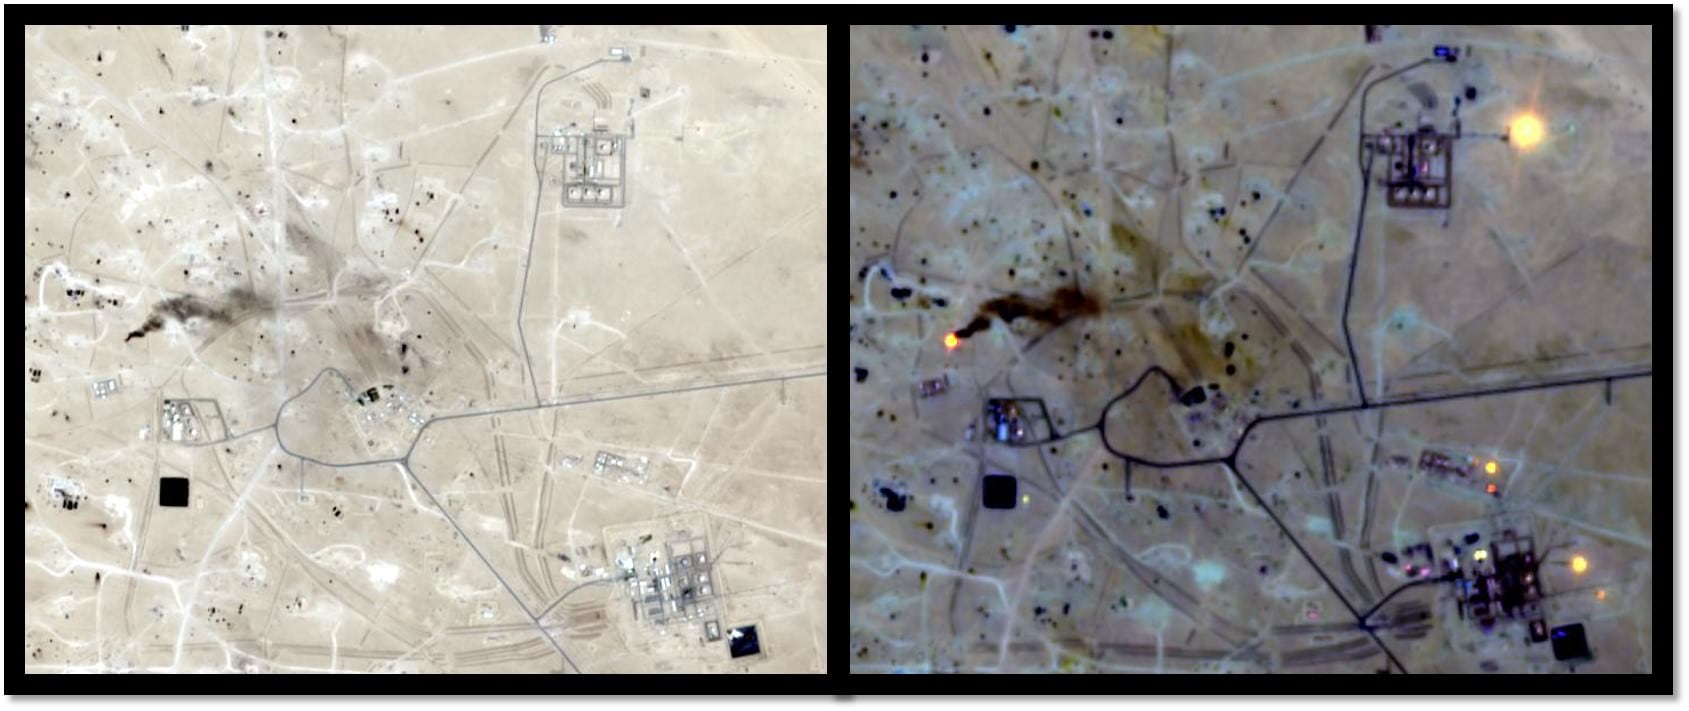
This example shows oil/natural gas wells in the Middle East: Natural Color (left) showing the optical wavelengths our eyes naturally detect and Short-Wave Infrared (right) which allows you to quickly detect several burning wells that are not readily detectable in the Natural Color image.

Heat signatures, and visibility through smoke, used to help manage wildfires.

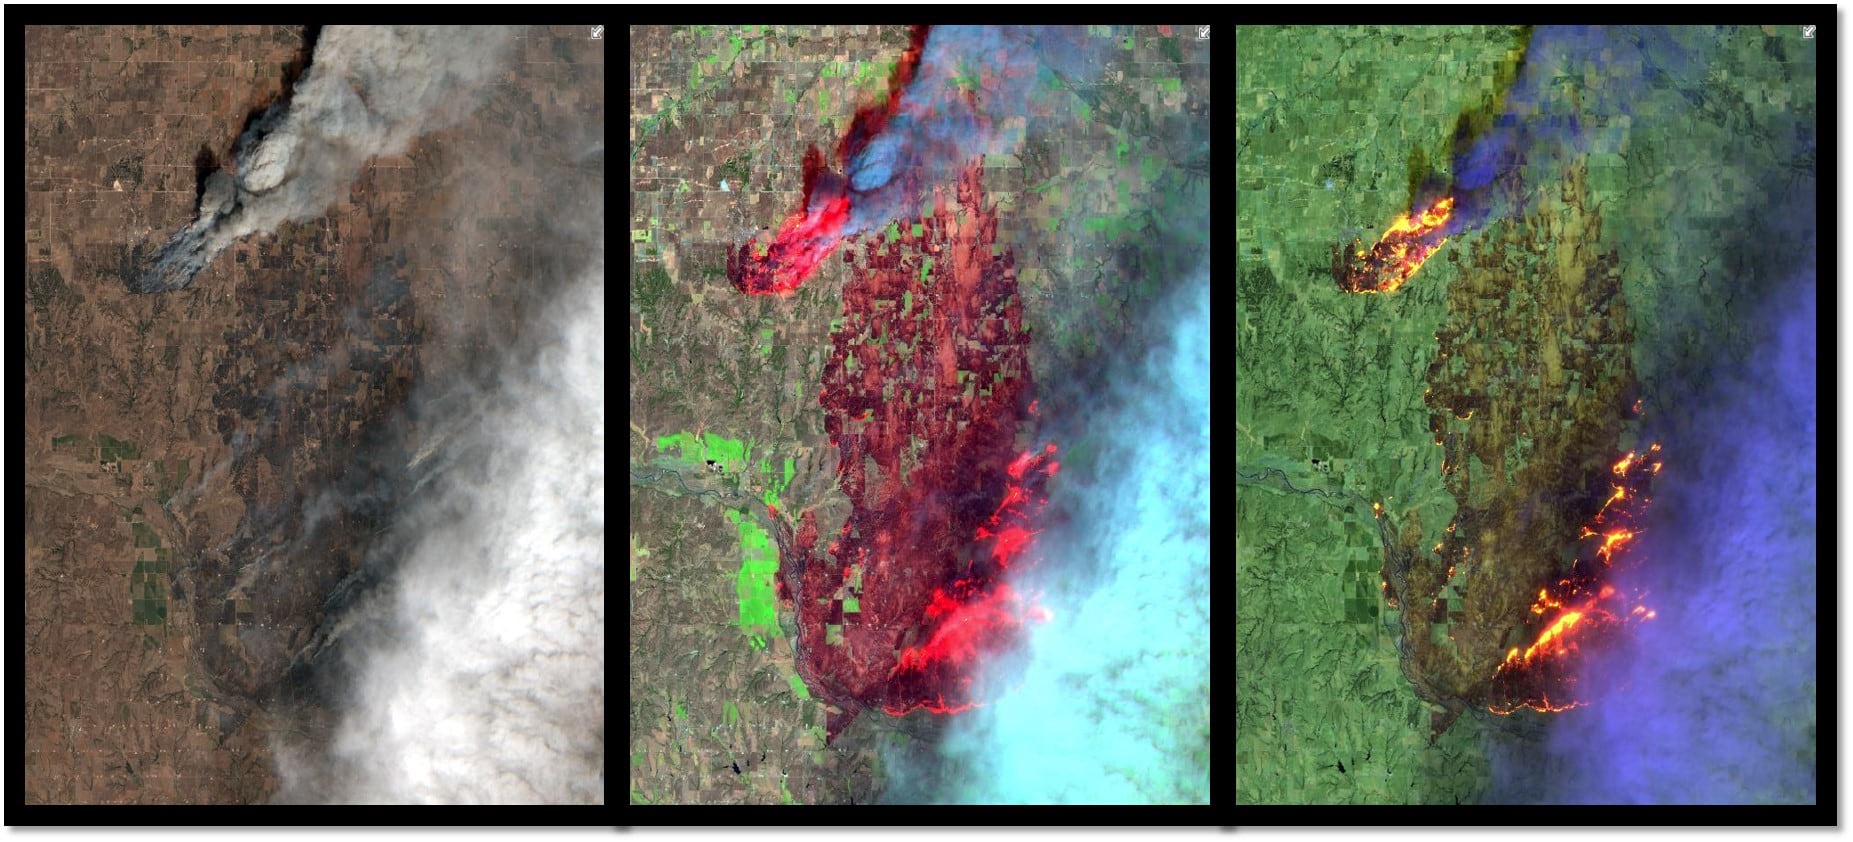
This example shows a recent Oklahoma wildfire in various Sentinel-2 band combinations: Natural Color (left) showing the optical wavelengths our eyes naturally detect, Short-Wave Infrared with Near Infrared wavelengths showing actual fire hotspots and highlighting burned areas, and a wider range of Short-Wave Infrared wavelengths (right) showing more refined hotspot detection.

Sentinel-2 can help us see all of this, and much more! Come and explore this fantastic resource with Esri and unlock more of Earth’s secrets. In the Living Atlas you will find the Sentinel-2 Views for full visualization and analysis, as well as a sample app providing a subset of these services in the Sentinel Explorer App. Also, check out additional ready to use layers in the ArcGIS Sentinel Imagery group.

If you would like to know more about Sentinel-2 and Esri’s image service, additional information and links are provided below.

More about Sentinel-2


Sentinel-2 is part of Copernicus, the world’s largest single Earth observation program directed by the European Commission (EC) in partnership with the European Space Agency (ESA). It provides multi-spectral data spanning 13 bands in the visible, near infrared, and short-wave infrared, with spatial resolution ranging from 10 meters to 60 meters. Sentinel-2 is continually collecting imagery from two Earth observation satellites that provide imagery for any land-based location in the world every 5-7 days.

Extending Esri’s Sentinel-2 image service


For users wishing to do more extensive predictive analysis, generate persisted products or access the entire archive, ArcGIS Image Server with the raster analysis capabilities can be set up on scalable Amazon Web Service (AWS) cloud infrastructure to apply a wide range of predefined or custom analysis against Sentinel 2 and a wide range of other sources. The Esri beta Sentinel-2 image service sources imagery from the Registry of Open Data on AWSand uses AWS server infrastructure in the Frankfurt region.

Current events and additional use cases


Using Esri’s Sentinel-2 image service can provide better visualization and understanding of catastrophic events such as Hawaii’s Kilauea volcano. The ability to use imagery of the volcano along with other spatial data, such as digital elevation models (DEM), provides an unprecedented opportunity to help predict lava flow direction and provide advanced notice to those who may be in danger.

Sentinel-2 service can also help provide understanding of the conditions that lead to fires such as this past winter’s Thomas Fire, which is California’s largest wildfire on record. The Thomas Fire burned over 280,000 acres and triggered massive mudslides. Visualizing factors, such as periods of increased moisture contributing to more lush vegetation followed by hot and dry weather, can help predict future wildfires and mitigate their effects in the future.

12 Comments
SteveCole
Honored Contributor

What's the reasoning / logic behind the decision to "firewall" or restrict this content within AGOL Organizational accounts? If I am not logged in, only the latest image is available. I know of friends in environmental organizations that would benefit from accessing this information but they don't have GIS and certainly don't have organizational AGOL accounts.

I wish ESRI would change their minds about this and, quite frankly, other public domain datasets "featured" within the Living Atlas that are currently restricted to organizational accounts.

Arpa_PiemonteGeoportal_Team
Frequent Contributor

Sentinel 2 imagery services are awesome and we are testing them in different real application.

Just one first question:

why the services are not time enabled? is there an easy way to visualize different images based on a time sliiders?

I know that it is possible to oi a filter by "acquisition date fileld"   but this functions actually is not so performant and  intuitive for final users.

Thank you

Enrico

SarahAnderson8
Emerging Contributor

Hello,

I'm wondering if the lag I'm experiencing from actual acquisition date to when that imagery is available in the Living Atlas Sentinel-2 Views mosaic imagery service is expected (lag) or if I'm not querying the dataset properly to get the absolute latest (user error)?

Although I can find and download scenes of Sentinel 2 imagery the day after it was acquired from other services such as Sinergise's EO Browser Sentinel Hub, it seems like the latest I can find in Esri's Living Atlas Sentinel2 Views dataset is always at least 3-4-5 days old.

Is this lag to be expected, or am I missing something in the process to ensure I'm seeing the absolute latest available imagery for an AOI?  In Pro, I add "Sentinel2 Views", then clear the definition queries, then Data-->Sort-->MostRecent.  I still get imagery that is several days or even a week old.

Is there a true lag or is this user error?

Thanks!

SteveCole
Honored Contributor

I'd like to know the answer to Sarah's question as well.

by Anonymous User
Not applicable

Thank you for your questions Sarah and Steve. Robert Waterman‌, can you weigh in on this?

RobertWaterman
Esri Contributor

Hi Sarah,

Based on what you described, removing the default definition query and sorting the images, it doesn't sound as though there is user error involved.

Our Sentinel-2 imagery is sourced from the Sentinel-2 Registry of Open Data on AWS.  There is about a one-day lag from the time the imagery is available there to the time it will be available in our service.

Unfortunately, we do not have control over the time from image collection to the time of availability on AWS.   The Sentinel-2 data on AWS is managed by Sinergise.

Regards,

Robert

SteveCole
Honored Contributor

So what controls the default image date used for a given area? I have an area of interest (-122.745 43.525 Degrees) that I am monitoring using the Sentinel-2 imagery and that area was not updated between October 30th and November 19th despite the fact that there was a cloud free acquisition on November 9th.

This was what I noticed whether I was using the Sentinel Explorer app or my own Web app that I created where I stored my AGOL organizational account credentials.

Steve

RobertWaterman
Esri Contributor

Hi Steve,

There is a definition query controlling what default image dates will be available for any given area.  This is designed to show the most recent and most cloud free imagery.  This default query can be removed and you can apply your own query.

I just did a quick test over your location.  If I remove the default query and then apply a query for images acquired between 10/29/2018 and 11/20/2018, I get 7 images returned.  One of which was acquired on 11/09/2018 (20181109T191222_10TEP_0).  Hopefully removing the default query and applying your own will resolve things for you.

Regards,

Robert

SteveCole
Honored Contributor

If this content is being used in in an AGOL web map, can I remove the definition query from there as well? My recollection is that I got the direct REST URL for the Sentinel-2 imagery from AGOL, then created a "new item from URL" within my AGOL Organizational account so that it had my organizational account authorization, and then added that item to a web map which I then shared publicly.

I'd prefer to hit on the most recent image in my map rather than best cloud-free option. I just don't know if I have that level of control from solely within AGOL rather than ArcGIS Pro which you're showing in your screenshot.

Thanks!

Steve

SteveCole
Honored Contributor

FYI, I have added an entry to the Ideas Page about the Sentinel-2 imagery. Despite the presence of date/time information, the layer is not recognized as a time aware layer. This means you cannot utilize the time aware configurable app with the Sentinel-2 service. Seems like this would be ideal since dealing with the filters in the service isn't that elegant so my Idea suggests making the Sentinel-2 imagery time aware so that it can be used with that app template.

Anyways, vote up if you find it useful.

JayJohnsonWashoeCounty
Frequent Contributor

We have a map viewer we've developed using the ESRI Python API - do the licensing terms allowed us to show Sentinel2 data within this viewer?

Patricia_C_Benitez_de_Lobos
Esri Contributor

Hello, I´d like to know if I could be directed to a Tutorial that will help me use the Time Range in ArcGIS Pro which automatically appears once Sentinel 2 images are included from the Living Atlas on to the contents.

In the first image, I was able to filter the time extent to only show images for 2024.  

Patricia_C_Benitez_de_Lobos_0-1715623400654.png
How do I define that the time interval to be shown on the map are the dates acquired? This way, I can see the date acquired when the image changes


About the Author
I promote the ArcGIS Living Atlas of the World through blog posts, webinars, and social media.