- Home
- :
- All Communities
- :
- Developers
- :
- JavaScript Maps SDK
- :
- JavaScript Maps SDK Questions
- :
- Showing radius line and measurement while drawing ...
- Subscribe to RSS Feed
- Mark Topic as New
- Mark Topic as Read
- Float this Topic for Current User
- Bookmark
- Subscribe
- Mute
- Printer Friendly Page
Showing radius line and measurement while drawing a circle on map
- Mark as New
- Bookmark
- Subscribe
- Mute
- Subscribe to RSS Feed
- Permalink
is anybody ever done this?
I haven't tried the following logic:
var centerPt=null;
//description:get distance between ptB and centerPt //return: number
function getDistance(ptB)
{
  if(centerPt==null||centerPt.mapPoint==null)
  {
  console.log("unexpected para,function getDistance()");
  return "";
  }
  var ptA=centerPt.mapPoint;
  return Math.sqrt(Math.pow(ptA.x-ptB.x,2)+Math.pow(ptA.y-ptB.y,2));
}


// get the center point


map.on("click", function(evt){
  centerPt = evt.mapPoint;
})

//onDragStart, record the centerPt
map.on("mouse-drag-start",function(evt)
{
  console.log("dragStart triggered");
  centerPt=evt;
  });

//onDrag, calculate distance between currentPoint and centerPt
map.on("mouse-drag",
  function(evt){
  var radius=getDistance(evt.mapPoint);
  console.log("radius is:"+radius);
  })
Solved! Go to Solution.
Accepted Solutions
- Mark as New
- Bookmark
- Subscribe
- Mute
- Subscribe to RSS Feed
- Permalink
Richard,
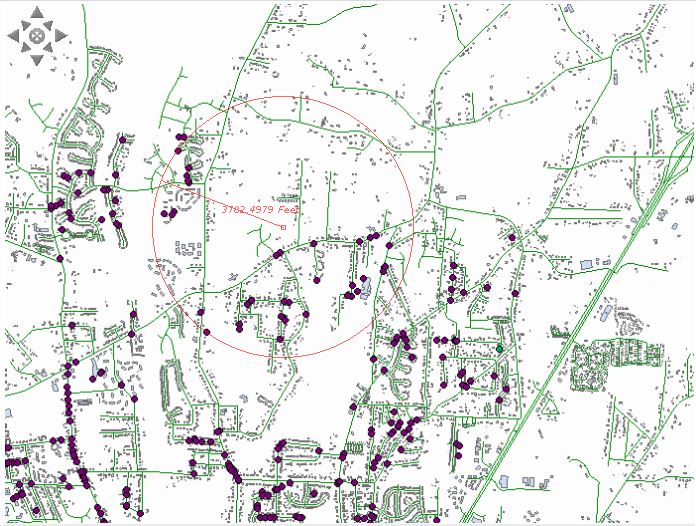
Here is a sample that draws the circle with a radius line and the measurement. It uses geometryEngine to calculate the size of the radius. If you are using a projected map, you would want to use a planarLength instead of a geodesicLength.
<!DOCTYPE html>
<html>


<head>
    <meta http-equiv="Content-Type" content="text/html; charset=utf-8">
    <meta name="viewport" content="initial-scale=1, maximum-scale=1,user-scalable=no" />
    <title>Circle with Measure</title>
    <link rel="stylesheet" href="https://js.arcgis.com/3.15/esri/css/esri.css">
    <style>
        html,
        body,
        #map {
            height: 100%;
            margin: 0;
            padding: 0;
        }
    </style>
    <script src="https://js.arcgis.com/3.15/"></script>
    <script>
        var map;


        require(["esri/map",
  "esri/graphic",
  "esri/geometry/Circle",
  "esri/geometry/Polyline",
  "esri/symbols/SimpleMarkerSymbol",
  "esri/symbols/SimpleFillSymbol",
  "esri/symbols/SimpleLineSymbol",
  "esri/symbols/TextSymbol",
  "esri/symbols/Font",
  "esri/Color",
  "esri/geometry/geometryEngine",
  "dojo/domReady!"],


        function(Map,
  Graphic,
  Circle,
  Polyline,
  SimpleMarkerSymbol,
  SimpleFillSymbol,
  SimpleLineSymbol,
  TextSymbol,
  Font,
  Color,
  geometryEngine) {


                    map = new Map("map", {
                        basemap: "topo", //For full list of pre-defined basemaps, navigate to http://arcg.is/1JVo6Wd
                        center: [-120.537, 46.592], // longitude, latitude
                        zoom: 13
                    });


                    var centerPt = null;
  var sfs = new SimpleFillSymbol(SimpleFillSymbol.STYLE_SOLID,
  new SimpleLineSymbol(SimpleLineSymbol.STYLE_DASHDOT,
  new Color([255,0,0]), 2),new Color([255,255,0,0.25])
  );
                    var drawCircle = new Graphic(null, sfs, null, null);
  var sls = new SimpleLineSymbol(SimpleLineSymbol.STYLE_SOLID, new Color([255,0,0]), 2)
  var radiusLine = new Graphic(null, sls, null, null);
  var font = new Font("20px", Font.STYLE_NORMAL, Font.VARIANT_NORMAL, Font.WEIGHT_BOLDER);
  var ts = new TextSymbol("");
  ts.setFont(font);
  ts.setColor(new Color([255,0,0]));
  ts.setOffset(0,20);
  var radiusText = new Graphic(null, ts, null, null);

                    //onDragStart, record the centerPt
                    map.on("mouse-drag-start", function(evt) {
                    map.graphics.add(drawCircle);
  map.graphics.add(radiusLine);
  map.graphics.add(radiusText);
                        centerPt = evt;
                    });


                    //onDrag, calculate distance between currentPoint and centerPt
                    map.on("mouse-drag", function(evt) {
  var pl = new Polyline(map.spatialReference);
  pl.addPath([centerPt.mapPoint, evt.mapPoint]);
  var radius = geometryEngine.geodesicLength(pl, "meters");
                        var circle = new Circle({center: centerPt.mapPoint, radius: radius, geodesic: true, spatialReference: map.spatialReference});;
                        drawCircle.setGeometry(circle);
  radiusLine.setGeometry(pl);
  ts.setText(radius.toFixed(1) + " meters");
  radiusText.setGeometry(centerPt.mapPoint);
                        console.log("radius is:" + radius);
                    });


  });
    </script>
</head>


<body>
    <div id="map"></div>
</body>


</html>
I have a working sample at: http://gis.yakimawa.gov/demo/circle.html
It is a bit unusual. Clicking and dragging the map pans the map. This example also draws a circle. You can also right mouse click and not pan, but you will see a context menu when you finish the circle.
Regards,
Tom
- Mark as New
- Bookmark
- Subscribe
- Mute
- Subscribe to RSS Feed
- Permalink
Richard,
Here is a sample that draws the circle with a radius line and the measurement. It uses geometryEngine to calculate the size of the radius. If you are using a projected map, you would want to use a planarLength instead of a geodesicLength.
<!DOCTYPE html>
<html>


<head>
    <meta http-equiv="Content-Type" content="text/html; charset=utf-8">
    <meta name="viewport" content="initial-scale=1, maximum-scale=1,user-scalable=no" />
    <title>Circle with Measure</title>
    <link rel="stylesheet" href="https://js.arcgis.com/3.15/esri/css/esri.css">
    <style>
        html,
        body,
        #map {
            height: 100%;
            margin: 0;
            padding: 0;
        }
    </style>
    <script src="https://js.arcgis.com/3.15/"></script>
    <script>
        var map;


        require(["esri/map",
  "esri/graphic",
  "esri/geometry/Circle",
  "esri/geometry/Polyline",
  "esri/symbols/SimpleMarkerSymbol",
  "esri/symbols/SimpleFillSymbol",
  "esri/symbols/SimpleLineSymbol",
  "esri/symbols/TextSymbol",
  "esri/symbols/Font",
  "esri/Color",
  "esri/geometry/geometryEngine",
  "dojo/domReady!"],


        function(Map,
  Graphic,
  Circle,
  Polyline,
  SimpleMarkerSymbol,
  SimpleFillSymbol,
  SimpleLineSymbol,
  TextSymbol,
  Font,
  Color,
  geometryEngine) {


                    map = new Map("map", {
                        basemap: "topo", //For full list of pre-defined basemaps, navigate to http://arcg.is/1JVo6Wd
                        center: [-120.537, 46.592], // longitude, latitude
                        zoom: 13
                    });


                    var centerPt = null;
  var sfs = new SimpleFillSymbol(SimpleFillSymbol.STYLE_SOLID,
  new SimpleLineSymbol(SimpleLineSymbol.STYLE_DASHDOT,
  new Color([255,0,0]), 2),new Color([255,255,0,0.25])
  );
                    var drawCircle = new Graphic(null, sfs, null, null);
  var sls = new SimpleLineSymbol(SimpleLineSymbol.STYLE_SOLID, new Color([255,0,0]), 2)
  var radiusLine = new Graphic(null, sls, null, null);
  var font = new Font("20px", Font.STYLE_NORMAL, Font.VARIANT_NORMAL, Font.WEIGHT_BOLDER);
  var ts = new TextSymbol("");
  ts.setFont(font);
  ts.setColor(new Color([255,0,0]));
  ts.setOffset(0,20);
  var radiusText = new Graphic(null, ts, null, null);

                    //onDragStart, record the centerPt
                    map.on("mouse-drag-start", function(evt) {
                    map.graphics.add(drawCircle);
  map.graphics.add(radiusLine);
  map.graphics.add(radiusText);
                        centerPt = evt;
                    });


                    //onDrag, calculate distance between currentPoint and centerPt
                    map.on("mouse-drag", function(evt) {
  var pl = new Polyline(map.spatialReference);
  pl.addPath([centerPt.mapPoint, evt.mapPoint]);
  var radius = geometryEngine.geodesicLength(pl, "meters");
                        var circle = new Circle({center: centerPt.mapPoint, radius: radius, geodesic: true, spatialReference: map.spatialReference});;
                        drawCircle.setGeometry(circle);
  radiusLine.setGeometry(pl);
  ts.setText(radius.toFixed(1) + " meters");
  radiusText.setGeometry(centerPt.mapPoint);
                        console.log("radius is:" + radius);
                    });


  });
    </script>
</head>


<body>
    <div id="map"></div>
</body>


</html>
I have a working sample at: http://gis.yakimawa.gov/demo/circle.html
It is a bit unusual. Clicking and dragging the map pans the map. This example also draws a circle. You can also right mouse click and not pan, but you will see a context menu when you finish the circle.
Regards,
Tom
- Mark as New
- Bookmark
- Subscribe
- Mute
- Subscribe to RSS Feed
- Permalink
Thank you Tom, this is a real good start.
I created a repository on Github with a demo sample. There is an issue though when switching the measurement units other than meters.
you can try view the demo here
https://github.com/rhyck-m/Drawing-circle-with-radius-measurement-display
- Mark as New
- Bookmark
- Subscribe
- Mute
- Subscribe to RSS Feed
- Permalink
Richard,
You are welcome. To calculate the radius you need the measured units in the same type as the base map you are using. If you want a the radius displayed in a different measure unit, you can convert the value or do a second geometryEngine.geodesicLength call.
Regards,
Tom