- Home
- :
- All Communities
- :
- Developers
- :
- JavaScript Maps SDK
- :
- JavaScript Maps SDK Questions
- :
- Re: Query task with geometry..?
- Subscribe to RSS Feed
- Mark Topic as New
- Mark Topic as Read
- Float this Topic for Current User
- Bookmark
- Subscribe
- Mute
- Printer Friendly Page
- Mark as New
- Bookmark
- Subscribe
- Mute
- Subscribe to RSS Feed
- Permalink
Is it possible to perform qeury task using geometries...? Wanna get results using square area or circle area on map..?
Thanks
Solved! Go to Solution.
Accepted Solutions
- Mark as New
- Bookmark
- Subscribe
- Mute
- Subscribe to RSS Feed
- Permalink
RAJ,
You were not far from the answer you just were not doing anything with the drawn geometry.
require([
"esri/Map",
"esri/views/MapView",
"esri/widgets/Home",
"esri/widgets/Legend",
"esri/widgets/Search",
"esri/layers/GraphicsLayer",
"esri/Graphic",
"esri/widgets/Sketch/SketchViewModel",
"esri/tasks/QueryTask",
"esri/tasks/support/Query",
"dojo/_base/array",
"dojo/dom",
"dojo/on",
"dgrid/OnDemandGrid",
"dgrid/extensions/ColumnHider",
"dojo/store/Memory",
"dstore/legacy/StoreAdapter",
"dgrid/Selection",
"dojo/_base/declare",
"dojo/dom-class",
"dojo/domReady!"
],
function(
Map, MapView, Home, Legend, Search, GraphicsLayer, Graphic, SketchViewModel, QueryTask, Query, arrayUtils, dom, on,
OnDemandGrid, ColumnHider, Memory, StoreAdapter, Selection, declare, domClass
) {
let map, view, grid, editGraphic;
const tempGraphicsLayer = new GraphicsLayer();
let RUrl = "https://services.arcgis.com/V6ZHFr6zdgNZuVG0/arcgis/rest/services/Prominent_Peaks_US/FeatureServer/0";
let FUrl = "https://services.arcgis.com/V6ZHFr6zdgNZuVG0/ArcGIS/rest/services/2015_06_26_active_fires_USA_contiguous_and_Hawaii_24h/FeatureServer/0";
let gridFields = ["__OBJECTID", "RANK", "MTN_PEAK", "STATE",
"ELEV_ft", "ELEV_m", "PROMINENCE_ft", "PROMINENCE_m"
];
// create a new datastore for the on demandgrid
// will be used to display attributes of selected features
let dataStore = new StoreAdapter({
objectStore: new Memory({
idProperty: "__OBJECTID"
})
});
const gridDis = document.getElementById("gridDisplay");
// Define the popup content for each result
const popupTemplate = { // autocasts as new PopupTemplate()
title: "{MTN_PEAK}, {STATE}",
fieldInfos: [{
fieldName: "ELEV_ft",
label: "Elevation (feet)",
format: {
places: 0,
digitSeperator: true
}
}, {
fieldName: "ELEV_m",
label: "Elevation (meters)",
format: {
places: 0,
digitSeperator: true
}
}, {
fieldName: "PROMINENCE_ft",
label: "Prominence (feet)",
format: {
places: 0,
digitSeperator: true
}
}, {
fieldName: "PROMINENCE_m",
label: "Prominence (meters)",
format: {
places: 0,
digitSeperator: true
}
}, {
fieldName: "ISOLATION_mi",
label: "Isolation (miles)",
format: {
places: 0,
digitSeperator: true
}
}, {
fieldName: "ISOLATION_km",
label: "Isolation (km)",
format: {
places: 0,
digitSeperator: true
}
}],
content: "<b><a href='https://en.wikipedia.org/wiki/Topographic_prominence'>Prominence:</a>" +
"</b> {PROMINENCE_ft} ft ({PROMINENCE_m} m)" +
"<br><b>Prominence Rank:</b> {RANK}" +
"<br><b>Elevation:</b> {ELEV_ft} ft ({ELEV_m} m)" +
"<br><b><a href='https://en.wikipedia.org/wiki/Topographic_isolation'>Isolation:</a>" +
"</b> {ISOLATION_mi} mi ({ISOLATION_km} km)"
};
// Define the popup content for each result
const popupTemplate2 = { // autocasts as new PopupTemplate()
title: "{TRACK}",
fieldInfos: [{
fieldName: "TRACK",
label: "Track"
}, {
fieldName: "BRIGHT_T31",
label: "Brightness",
format: {
places: 0,
digitSeperator: true
}
}, {
fieldName: "CONFIDENCE",
label: "Confidence"
}, {
fieldName: "SCAN",
label: "Scan",
format: {
places: 0,
digitSeperator: true
}
}],
content: "Brightness: {BRIGHT_T31}" +
"<br><b>Prominence Rank:</b> {RANK}" +
"<br><b>Confidence:</b> {CONFIDENCE}" +
"<br><b>Scan: {SCAN}"
};
let resultsLayer = new GraphicsLayer();
let resultsLayer2 = new GraphicsLayer();
let qTask = new QueryTask({
url: RUrl
});
let qTask2 = new QueryTask({
url: FUrl
});
let params = new Query({
returnGeometry: true
});
map = new Map({
basemap: "streets",
layers: [resultsLayer, resultsLayer2, tempGraphicsLayer]
});
view = new MapView({
map: map,
container: "viewDiv",
zoom: 3,
popup: {
dockEnabled: true,
dockOptions: {
position: "top-right",
breakpoint: false
}
}
});
function createGrid(fields) {
var columns = fields.filter(function(field, i) {
if (gridFields.indexOf(field.name) !== -1) {
return field;
}
}).map(function(field) {
if (field.name === "__OBJECTID") {
return {
field: field.name,
label: field.name,
sortable: true,
hidden: true
};
} else {
return {
field: field.name,
label: field.alias,
sortable: true
};
}
});
// create a new onDemandGrid with its selection and columnhider
// extensions. Set the columns of the grid to display attributes
// the hurricanes cvslayer
grid = new(declare([OnDemandGrid, Selection, ColumnHider]))({
columns: columns
}, "grid");
// add a row-click listener on the grid. This will be used
// to highlight the corresponding feature on the view
grid.on("dgrid-select", selectFeatureFromGrid);
}
function selectFeatureFromGrid(event) {
}
view.when(function() {
view.ui.add("optionsDiv", "bottom-right");
on(dom.byId("doBtn"), "click", doQuery);
on(dom.byId("clrBtn"), "click", doClear);
//Query to get unique vals
let opt_ = document.createElement('option');
opt_.value = "";
opt_.innerHTML = "select State";
let opt__ = document.createElement('option');
opt__.value = "";
opt__.innerHTML = "select Peak";
statedd.appendChild(opt_);
peakdd.appendChild(opt__);
let qUVState = new Query({
returnGeometry: false,
where: '1=1',
returnDistinctValues: true,
outFields: ['STATE'],
orderByFields: ['STATE ASC']
});
qTask.execute(qUVState).then(function(results) {
results.features.map(function(feat) {
let opt = document.createElement('option');
opt.value = feat.attributes.STATE;
opt.innerHTML = feat.attributes.STATE;
statedd.appendChild(opt);
});
});
let qUVPeak = new Query({
returnGeometry: false,
where: '1=1',
returnDistinctValues: true,
outFields: ['MTN_PEAK'],
orderByFields: ['MTN_PEAK ASC']
});
qTask.execute(qUVPeak).then(function(results) {
results.features.map(function(feat) {
let opt2 = document.createElement('option');
opt2.value = feat.attributes.MTN_PEAK;
opt2.innerHTML = feat.attributes.MTN_PEAK;
peakdd.appendChild(opt2);
});
});
});
const attributeName = dom.byId("attSelect");
const expressionSign = dom.byId("signSelect");
const value = dom.byId("valSelect");
const wlayer = dom.byId("lyrSelect");
const statedd = dom.byId("stateSelect");
const peakdd = dom.byId("peakSelect");
function doClear() {
if (grid) {
dataStore.objectStore.data = {};
grid.set("collection", dataStore);
}
resultsLayer2.removeAll();
gridDis.style.display = 'none';
domClass.remove("viewDiv", 'withGrid');
}
function doQuery() {
doClear();
// Clear the results from a previous query
resultsLayer.removeAll();
resultsLayer2.removeAll();
let whereC = [];
if(statedd.value !== ''){
whereC.push("STATE = '" + statedd.value + "'");
}
if (peakdd.value !== ''){
whereC.push("MTN_PEAK = '" + peakdd.value + "'");
}
whereC.push(attributeName.value + expressionSign.value + value.value);
params.where = whereC.join(' AND ');
if (wlayer.value === 'peaks') {
if(tempGraphicsLayer.graphics.length >0){
params.geometry = tempGraphicsLayer.graphics.getItemAt(0).geometry;
}
params.outFields = ["RANK", "MTN_PEAK", "STATE",
"ELEV_ft", "ELEV_m", "PROMINENCE_ft", "PROMINENCE_m"
];
gridFields = ["__OBJECTID", "RANK", "MTN_PEAK", "STATE",
"ELEV_ft", "ELEV_m", "PROMINENCE_ft", "PROMINENCE_m"
];
qTask.execute(params)
.then(getResults)
.catch(promiseRejected);
} else if (wlayer.value === 'fires') {
params.outFields = ["BRIGHTNESS", "SCAN", "TRACK",
"ACQ_DATE", "ACQ_TIME", "SATELLITE", "CONFIDENCE", "VERSION"
];
gridFields = ["__OBJECTID", "BRIGHTNESS", "SCAN", "TRACK",
"ACQ_DATE", "ACQ_TIME", "SATELLITE", "CONFIDENCE", "VERSION"
];
params.where = 'BRIGHTNESS > 320';
qTask2.execute(params)
.then(getResults)
.catch(promiseRejected);
}
}
function getResults(response) {
let graphics = response.features;
if (graphics.length > 0) {
gridDis.style.display = 'block';
domClass.add("viewDiv", 'withGrid');
document.getElementById("featureCount").innerHTML =
"<b>Showing attributes for " +
graphics.length.toString() + " features </b>"
} else {
gridDis.style.display = 'none';
}
createGrid(response.fields);
// get the attributes to display in the grid
var data = graphics.map(function(feature, i) {
return Object.keys(feature.attributes)
.filter(function(key) {
// get fields that exist in the grid
return (gridFields.indexOf(key) !== -1);
})
// need to create key value pairs from the feature
// attributes so that info can be displayed in the grid
.reduce((obj, key) => {
obj[key] = feature.attributes[key];
return obj;
}, {});
});
// set the datastore for the grid using the
// attributes we got for the query results
dataStore.objectStore.data = data;
grid.set("collection", dataStore);
var RResults = arrayUtils.map(response.features, function(
feature) {
feature.symbol = {
type: "simple-marker",
color: "red",
size: 5,
outline: {
color: "black"
}
};
if (wlayer.value === 'peaks') {
feature.popupTemplate = popupTemplate;
} else if (wlayer.value === 'fires') {
feature.popupTemplate = popupTemplate2;
}
return feature;
});
if (wlayer.value === 'peaks') {
resultsLayer.addMany(RResults);
} else if (wlayer.value === 'fires') {
resultsLayer2.addMany(RResults);
}
view.goTo(RResults);
}
function promiseRejected(error) {
console.error("Promise rejected: ", error.message);
}
var homeBtn = new Home({
view: view
}, "homeDiv");
var legend = new Legend({
view: view,
layerInfos: [{
url: RUrl
}]
});
legend.startup();
view.ui.add(legend, "bottom-left");
var searchWidget = new Search({
view: view
});
view.ui.add(searchWidget, {
position: "top-right"
});
view.when(function() {
// create a new sketch view model
const sketchViewModel = new SketchViewModel({
view: view,
layer: tempGraphicsLayer,
pointSymbol: {
type: "simple-marker", // autocasts as new SimpleMarkerSymbol()
style: "square",
color: "#8A2BE2",
size: "16px",
outline: { // autocasts as new SimpleLineSymbol()
color: [255, 255, 255],
width: 3
}
},
polylineSymbol: {
type: "simple-line", // autocasts as new SimpleLineSymbol()
color: "#8A2BE2",
width: "4",
style: "dash"
},
polygonSymbol: {
type: "simple-fill", // autocasts as new SimpleFillSymbol()
color: "rgba(138,43,226, 0.8)",
style: "solid",
outline: {
color: "white",
width: 1
}
}
});
setUpClickHandler();
// Listen to create-complete event to add a newly created graphic to view
sketchViewModel.on("create-complete", addGraphic);
// Listen the sketchViewModel's update-complete and update-cancel events
sketchViewModel.on("update-complete", updateGraphic);
sketchViewModel.on("update-cancel", updateGraphic);
//*************************************************************
// called when sketchViewModel's create-complete event is fired.
//*************************************************************
function addGraphic(event) {
// Create a new graphic and set its geometry to
// `create-complete` event geometry.
const graphic = new Graphic({
geometry: event.geometry,
symbol: sketchViewModel.graphic.symbol
});
tempGraphicsLayer.add(graphic);
}
//***************************************************************
// called when sketchViewModel's update-complete or update-cancel
// events are fired.
//*************************************************************
function updateGraphic(event) {
// event.graphic is the graphic that user clicked on and its geometry
// has not been changed. Update its geometry and add it to the layer
event.graphic.geometry = event.geometry;
tempGraphicsLayer.add(event.graphic);
// set the editGraphic to null update is complete or cancelled.
editGraphic = null;
}
// ************************************************************************************
// set up logic to handle geometry update and reflect the update on "tempGraphicsLayer"
// ************************************************************************************
function setUpClickHandler() {
view.on("click", function(event) {
view.hitTest(event).then(function(response) {
var results = response.results;
// Found a valid graphic
if (results.length && results[results.length - 1]
.graphic) {
// Check if we're already editing a graphic
if (!editGraphic) {
// Save a reference to the graphic we intend to update
editGraphic = results[results.length - 1].graphic;
// Remove the graphic from the GraphicsLayer
// Sketch will handle displaying the graphic while being updated
tempGraphicsLayer.remove(editGraphic);
sketchViewModel.update(editGraphic);
}
}
});
});
}
//*************************************
// activate the sketch to create a point
//*************************************
var drawPointButton = document.getElementById("pointButton");
drawPointButton.onclick = function() {
// set the sketch to create a point geometry
sketchViewModel.create("point");
setActiveButton(this);
};
//****************************************
// activate the sketch to create a polyline
//****************************************
var drawLineButton = document.getElementById("polylineButton");
drawLineButton.onclick = function() {
// set the sketch to create a polyline geometry
sketchViewModel.create("polyline");
setActiveButton(this);
};
//***************************************
// activate the sketch to create a polygon
//***************************************
var drawPolygonButton = document.getElementById("polygonButton");
drawPolygonButton.onclick = function() {
// set the sketch to create a polygon geometry
sketchViewModel.create("polygon");
setActiveButton(this);
};
//***************************************
// activate the sketch to create a rectangle
//***************************************
var drawRectangleButton = document.getElementById(
"rectangleButton");
drawRectangleButton.onclick = function() {
// set the sketch to create a polygon geometry
sketchViewModel.create("rectangle");
setActiveButton(this);
};
//***************************************
// activate the sketch to create a circle
//***************************************
var drawCircleButton = document.getElementById("circleButton");
drawCircleButton.onclick = function() {
// set the sketch to create a polygon geometry
sketchViewModel.create("circle");
setActiveButton(this);
};
//**************
// reset button
//**************
document.getElementById("resetBtn").onclick = function() {
sketchViewModel.reset();
tempGraphicsLayer.removeAll();
setActiveButton();
};
function setActiveButton(selectedButton) {
// focus the view to activate keyboard shortcuts for sketching
view.focus();
var elements = document.getElementsByClassName("active");
for (var i = 0; i < elements.length; i++) {
elements.classList.remove("active");
}
if (selectedButton) {
selectedButton.classList.add("active");
}
}
});
});- Mark as New
- Bookmark
- Subscribe
- Mute
- Subscribe to RSS Feed
- Permalink
RAJ,
Sure here is a sample that queries based on the view extent.
- Mark as New
- Bookmark
- Subscribe
- Mute
- Subscribe to RSS Feed
- Permalink
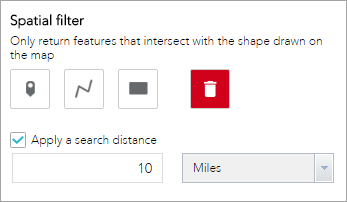
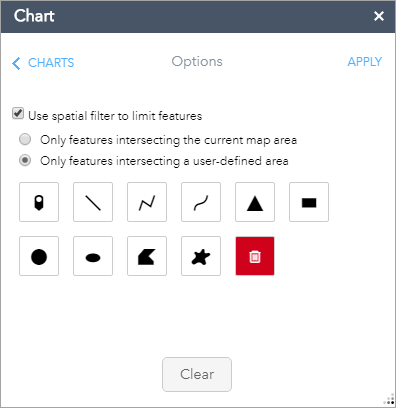
Above sample also helpful. But am looking for user defined geometry query task (spatial filter).. So he can draw a geometry(extent, circle, freehand polygon ) along with query task.. So the result combined both ones..
- Mark as New
- Bookmark
- Subscribe
- Mute
- Subscribe to RSS Feed
- Permalink
RAJ,
For something like that you would have to combine this sample with what you have:
- Mark as New
- Bookmark
- Subscribe
- Mute
- Subscribe to RSS Feed
- Permalink
Thank you for the link Robert.. I'll try to combine it along with the query task.. 
- Mark as New
- Bookmark
- Subscribe
- Mute
- Subscribe to RSS Feed
- Permalink
Hi Robert, I tried to add this spatial filter into existing query but cant able to use it with queries. can you help me out..only able to use as a sketch tool to draw these geometries..
- Mark as New
- Bookmark
- Subscribe
- Mute
- Subscribe to RSS Feed
- Permalink
Post what have tried and I will point out issues.
- Mark as New
- Bookmark
- Subscribe
- Mute
- Subscribe to RSS Feed
- Permalink
Am sharing fiddle. Please check it once.
QueryTask - 4.8\n \n \n\n\n\n \n \n Prominent Peaks in the U.S.\n \n US Fires\n US Peaks\n…
- Mark as New
- Bookmark
- Subscribe
- Mute
- Subscribe to RSS Feed
- Permalink
RAJ,
You were not far from the answer you just were not doing anything with the drawn geometry.
require([
"esri/Map",
"esri/views/MapView",
"esri/widgets/Home",
"esri/widgets/Legend",
"esri/widgets/Search",
"esri/layers/GraphicsLayer",
"esri/Graphic",
"esri/widgets/Sketch/SketchViewModel",
"esri/tasks/QueryTask",
"esri/tasks/support/Query",
"dojo/_base/array",
"dojo/dom",
"dojo/on",
"dgrid/OnDemandGrid",
"dgrid/extensions/ColumnHider",
"dojo/store/Memory",
"dstore/legacy/StoreAdapter",
"dgrid/Selection",
"dojo/_base/declare",
"dojo/dom-class",
"dojo/domReady!"
],
function(
Map, MapView, Home, Legend, Search, GraphicsLayer, Graphic, SketchViewModel, QueryTask, Query, arrayUtils, dom, on,
OnDemandGrid, ColumnHider, Memory, StoreAdapter, Selection, declare, domClass
) {
let map, view, grid, editGraphic;
const tempGraphicsLayer = new GraphicsLayer();
let RUrl = "https://services.arcgis.com/V6ZHFr6zdgNZuVG0/arcgis/rest/services/Prominent_Peaks_US/FeatureServer/0";
let FUrl = "https://services.arcgis.com/V6ZHFr6zdgNZuVG0/ArcGIS/rest/services/2015_06_26_active_fires_USA_contiguous_and_Hawaii_24h/FeatureServer/0";
let gridFields = ["__OBJECTID", "RANK", "MTN_PEAK", "STATE",
"ELEV_ft", "ELEV_m", "PROMINENCE_ft", "PROMINENCE_m"
];
// create a new datastore for the on demandgrid
// will be used to display attributes of selected features
let dataStore = new StoreAdapter({
objectStore: new Memory({
idProperty: "__OBJECTID"
})
});
const gridDis = document.getElementById("gridDisplay");
// Define the popup content for each result
const popupTemplate = { // autocasts as new PopupTemplate()
title: "{MTN_PEAK}, {STATE}",
fieldInfos: [{
fieldName: "ELEV_ft",
label: "Elevation (feet)",
format: {
places: 0,
digitSeperator: true
}
}, {
fieldName: "ELEV_m",
label: "Elevation (meters)",
format: {
places: 0,
digitSeperator: true
}
}, {
fieldName: "PROMINENCE_ft",
label: "Prominence (feet)",
format: {
places: 0,
digitSeperator: true
}
}, {
fieldName: "PROMINENCE_m",
label: "Prominence (meters)",
format: {
places: 0,
digitSeperator: true
}
}, {
fieldName: "ISOLATION_mi",
label: "Isolation (miles)",
format: {
places: 0,
digitSeperator: true
}
}, {
fieldName: "ISOLATION_km",
label: "Isolation (km)",
format: {
places: 0,
digitSeperator: true
}
}],
content: "<b><a href='https://en.wikipedia.org/wiki/Topographic_prominence'>Prominence:</a>" +
"</b> {PROMINENCE_ft} ft ({PROMINENCE_m} m)" +
"<br><b>Prominence Rank:</b> {RANK}" +
"<br><b>Elevation:</b> {ELEV_ft} ft ({ELEV_m} m)" +
"<br><b><a href='https://en.wikipedia.org/wiki/Topographic_isolation'>Isolation:</a>" +
"</b> {ISOLATION_mi} mi ({ISOLATION_km} km)"
};
// Define the popup content for each result
const popupTemplate2 = { // autocasts as new PopupTemplate()
title: "{TRACK}",
fieldInfos: [{
fieldName: "TRACK",
label: "Track"
}, {
fieldName: "BRIGHT_T31",
label: "Brightness",
format: {
places: 0,
digitSeperator: true
}
}, {
fieldName: "CONFIDENCE",
label: "Confidence"
}, {
fieldName: "SCAN",
label: "Scan",
format: {
places: 0,
digitSeperator: true
}
}],
content: "Brightness: {BRIGHT_T31}" +
"<br><b>Prominence Rank:</b> {RANK}" +
"<br><b>Confidence:</b> {CONFIDENCE}" +
"<br><b>Scan: {SCAN}"
};
let resultsLayer = new GraphicsLayer();
let resultsLayer2 = new GraphicsLayer();
let qTask = new QueryTask({
url: RUrl
});
let qTask2 = new QueryTask({
url: FUrl
});
let params = new Query({
returnGeometry: true
});
map = new Map({
basemap: "streets",
layers: [resultsLayer, resultsLayer2, tempGraphicsLayer]
});
view = new MapView({
map: map,
container: "viewDiv",
zoom: 3,
popup: {
dockEnabled: true,
dockOptions: {
position: "top-right",
breakpoint: false
}
}
});
function createGrid(fields) {
var columns = fields.filter(function(field, i) {
if (gridFields.indexOf(field.name) !== -1) {
return field;
}
}).map(function(field) {
if (field.name === "__OBJECTID") {
return {
field: field.name,
label: field.name,
sortable: true,
hidden: true
};
} else {
return {
field: field.name,
label: field.alias,
sortable: true
};
}
});
// create a new onDemandGrid with its selection and columnhider
// extensions. Set the columns of the grid to display attributes
// the hurricanes cvslayer
grid = new(declare([OnDemandGrid, Selection, ColumnHider]))({
columns: columns
}, "grid");
// add a row-click listener on the grid. This will be used
// to highlight the corresponding feature on the view
grid.on("dgrid-select", selectFeatureFromGrid);
}
function selectFeatureFromGrid(event) {
}
view.when(function() {
view.ui.add("optionsDiv", "bottom-right");
on(dom.byId("doBtn"), "click", doQuery);
on(dom.byId("clrBtn"), "click", doClear);
//Query to get unique vals
let opt_ = document.createElement('option');
opt_.value = "";
opt_.innerHTML = "select State";
let opt__ = document.createElement('option');
opt__.value = "";
opt__.innerHTML = "select Peak";
statedd.appendChild(opt_);
peakdd.appendChild(opt__);
let qUVState = new Query({
returnGeometry: false,
where: '1=1',
returnDistinctValues: true,
outFields: ['STATE'],
orderByFields: ['STATE ASC']
});
qTask.execute(qUVState).then(function(results) {
results.features.map(function(feat) {
let opt = document.createElement('option');
opt.value = feat.attributes.STATE;
opt.innerHTML = feat.attributes.STATE;
statedd.appendChild(opt);
});
});
let qUVPeak = new Query({
returnGeometry: false,
where: '1=1',
returnDistinctValues: true,
outFields: ['MTN_PEAK'],
orderByFields: ['MTN_PEAK ASC']
});
qTask.execute(qUVPeak).then(function(results) {
results.features.map(function(feat) {
let opt2 = document.createElement('option');
opt2.value = feat.attributes.MTN_PEAK;
opt2.innerHTML = feat.attributes.MTN_PEAK;
peakdd.appendChild(opt2);
});
});
});
const attributeName = dom.byId("attSelect");
const expressionSign = dom.byId("signSelect");
const value = dom.byId("valSelect");
const wlayer = dom.byId("lyrSelect");
const statedd = dom.byId("stateSelect");
const peakdd = dom.byId("peakSelect");
function doClear() {
if (grid) {
dataStore.objectStore.data = {};
grid.set("collection", dataStore);
}
resultsLayer2.removeAll();
gridDis.style.display = 'none';
domClass.remove("viewDiv", 'withGrid');
}
function doQuery() {
doClear();
// Clear the results from a previous query
resultsLayer.removeAll();
resultsLayer2.removeAll();
let whereC = [];
if(statedd.value !== ''){
whereC.push("STATE = '" + statedd.value + "'");
}
if (peakdd.value !== ''){
whereC.push("MTN_PEAK = '" + peakdd.value + "'");
}
whereC.push(attributeName.value + expressionSign.value + value.value);
params.where = whereC.join(' AND ');
if (wlayer.value === 'peaks') {
if(tempGraphicsLayer.graphics.length >0){
params.geometry = tempGraphicsLayer.graphics.getItemAt(0).geometry;
}
params.outFields = ["RANK", "MTN_PEAK", "STATE",
"ELEV_ft", "ELEV_m", "PROMINENCE_ft", "PROMINENCE_m"
];
gridFields = ["__OBJECTID", "RANK", "MTN_PEAK", "STATE",
"ELEV_ft", "ELEV_m", "PROMINENCE_ft", "PROMINENCE_m"
];
qTask.execute(params)
.then(getResults)
.catch(promiseRejected);
} else if (wlayer.value === 'fires') {
params.outFields = ["BRIGHTNESS", "SCAN", "TRACK",
"ACQ_DATE", "ACQ_TIME", "SATELLITE", "CONFIDENCE", "VERSION"
];
gridFields = ["__OBJECTID", "BRIGHTNESS", "SCAN", "TRACK",
"ACQ_DATE", "ACQ_TIME", "SATELLITE", "CONFIDENCE", "VERSION"
];
params.where = 'BRIGHTNESS > 320';
qTask2.execute(params)
.then(getResults)
.catch(promiseRejected);
}
}
function getResults(response) {
let graphics = response.features;
if (graphics.length > 0) {
gridDis.style.display = 'block';
domClass.add("viewDiv", 'withGrid');
document.getElementById("featureCount").innerHTML =
"<b>Showing attributes for " +
graphics.length.toString() + " features </b>"
} else {
gridDis.style.display = 'none';
}
createGrid(response.fields);
// get the attributes to display in the grid
var data = graphics.map(function(feature, i) {
return Object.keys(feature.attributes)
.filter(function(key) {
// get fields that exist in the grid
return (gridFields.indexOf(key) !== -1);
})
// need to create key value pairs from the feature
// attributes so that info can be displayed in the grid
.reduce((obj, key) => {
obj[key] = feature.attributes[key];
return obj;
}, {});
});
// set the datastore for the grid using the
// attributes we got for the query results
dataStore.objectStore.data = data;
grid.set("collection", dataStore);
var RResults = arrayUtils.map(response.features, function(
feature) {
feature.symbol = {
type: "simple-marker",
color: "red",
size: 5,
outline: {
color: "black"
}
};
if (wlayer.value === 'peaks') {
feature.popupTemplate = popupTemplate;
} else if (wlayer.value === 'fires') {
feature.popupTemplate = popupTemplate2;
}
return feature;
});
if (wlayer.value === 'peaks') {
resultsLayer.addMany(RResults);
} else if (wlayer.value === 'fires') {
resultsLayer2.addMany(RResults);
}
view.goTo(RResults);
}
function promiseRejected(error) {
console.error("Promise rejected: ", error.message);
}
var homeBtn = new Home({
view: view
}, "homeDiv");
var legend = new Legend({
view: view,
layerInfos: [{
url: RUrl
}]
});
legend.startup();
view.ui.add(legend, "bottom-left");
var searchWidget = new Search({
view: view
});
view.ui.add(searchWidget, {
position: "top-right"
});
view.when(function() {
// create a new sketch view model
const sketchViewModel = new SketchViewModel({
view: view,
layer: tempGraphicsLayer,
pointSymbol: {
type: "simple-marker", // autocasts as new SimpleMarkerSymbol()
style: "square",
color: "#8A2BE2",
size: "16px",
outline: { // autocasts as new SimpleLineSymbol()
color: [255, 255, 255],
width: 3
}
},
polylineSymbol: {
type: "simple-line", // autocasts as new SimpleLineSymbol()
color: "#8A2BE2",
width: "4",
style: "dash"
},
polygonSymbol: {
type: "simple-fill", // autocasts as new SimpleFillSymbol()
color: "rgba(138,43,226, 0.8)",
style: "solid",
outline: {
color: "white",
width: 1
}
}
});
setUpClickHandler();
// Listen to create-complete event to add a newly created graphic to view
sketchViewModel.on("create-complete", addGraphic);
// Listen the sketchViewModel's update-complete and update-cancel events
sketchViewModel.on("update-complete", updateGraphic);
sketchViewModel.on("update-cancel", updateGraphic);
//*************************************************************
// called when sketchViewModel's create-complete event is fired.
//*************************************************************
function addGraphic(event) {
// Create a new graphic and set its geometry to
// `create-complete` event geometry.
const graphic = new Graphic({
geometry: event.geometry,
symbol: sketchViewModel.graphic.symbol
});
tempGraphicsLayer.add(graphic);
}
//***************************************************************
// called when sketchViewModel's update-complete or update-cancel
// events are fired.
//*************************************************************
function updateGraphic(event) {
// event.graphic is the graphic that user clicked on and its geometry
// has not been changed. Update its geometry and add it to the layer
event.graphic.geometry = event.geometry;
tempGraphicsLayer.add(event.graphic);
// set the editGraphic to null update is complete or cancelled.
editGraphic = null;
}
// ************************************************************************************
// set up logic to handle geometry update and reflect the update on "tempGraphicsLayer"
// ************************************************************************************
function setUpClickHandler() {
view.on("click", function(event) {
view.hitTest(event).then(function(response) {
var results = response.results;
// Found a valid graphic
if (results.length && results[results.length - 1]
.graphic) {
// Check if we're already editing a graphic
if (!editGraphic) {
// Save a reference to the graphic we intend to update
editGraphic = results[results.length - 1].graphic;
// Remove the graphic from the GraphicsLayer
// Sketch will handle displaying the graphic while being updated
tempGraphicsLayer.remove(editGraphic);
sketchViewModel.update(editGraphic);
}
}
});
});
}
//*************************************
// activate the sketch to create a point
//*************************************
var drawPointButton = document.getElementById("pointButton");
drawPointButton.onclick = function() {
// set the sketch to create a point geometry
sketchViewModel.create("point");
setActiveButton(this);
};
//****************************************
// activate the sketch to create a polyline
//****************************************
var drawLineButton = document.getElementById("polylineButton");
drawLineButton.onclick = function() {
// set the sketch to create a polyline geometry
sketchViewModel.create("polyline");
setActiveButton(this);
};
//***************************************
// activate the sketch to create a polygon
//***************************************
var drawPolygonButton = document.getElementById("polygonButton");
drawPolygonButton.onclick = function() {
// set the sketch to create a polygon geometry
sketchViewModel.create("polygon");
setActiveButton(this);
};
//***************************************
// activate the sketch to create a rectangle
//***************************************
var drawRectangleButton = document.getElementById(
"rectangleButton");
drawRectangleButton.onclick = function() {
// set the sketch to create a polygon geometry
sketchViewModel.create("rectangle");
setActiveButton(this);
};
//***************************************
// activate the sketch to create a circle
//***************************************
var drawCircleButton = document.getElementById("circleButton");
drawCircleButton.onclick = function() {
// set the sketch to create a polygon geometry
sketchViewModel.create("circle");
setActiveButton(this);
};
//**************
// reset button
//**************
document.getElementById("resetBtn").onclick = function() {
sketchViewModel.reset();
tempGraphicsLayer.removeAll();
setActiveButton();
};
function setActiveButton(selectedButton) {
// focus the view to activate keyboard shortcuts for sketching
view.focus();
var elements = document.getElementsByClassName("active");
for (var i = 0; i < elements.length; i++) {
elements.classList.remove("active");
}
if (selectedButton) {
selectedButton.classList.add("active");
}
}
});
});- Mark as New
- Bookmark
- Subscribe
- Mute
- Subscribe to RSS Feed
- Permalink
Its perfectly working. Let me check again how it works. I tried to do it with using
spatialRelationship: "esriSpatialRelIntersects",
outFields: ["*"]
but it was difficult for me to use both(queries and spatial filter) with each other..
Appreciate your help Robert. Thanks a lot..