Turn on suggestions
Auto-suggest helps you quickly narrow down your search results by suggesting possible matches as you type.
Cancel
- Home
- :
- All Communities
- :
- Developers
- :
- JavaScript Maps SDK
- :
- JavaScript Maps SDK Questions
- :
- Re: Query & QueryTask with a feature layer not sho...
Options
- Subscribe to RSS Feed
- Mark Topic as New
- Mark Topic as Read
- Float this Topic for Current User
- Bookmark
- Subscribe
- Mute
- Printer Friendly Page
Query & QueryTask with a feature layer not shown until Query Task executed
Subscribe
03-06-2014
11:52 AM
- Mark as New
- Bookmark
- Subscribe
- Mute
- Subscribe to RSS Feed
- Permalink
I am trying to query a feature layer that is not shown on the map until the query is actually executed. I have a button that I am using to set off the query when it is clicked. Here is the code that I am trying to use:
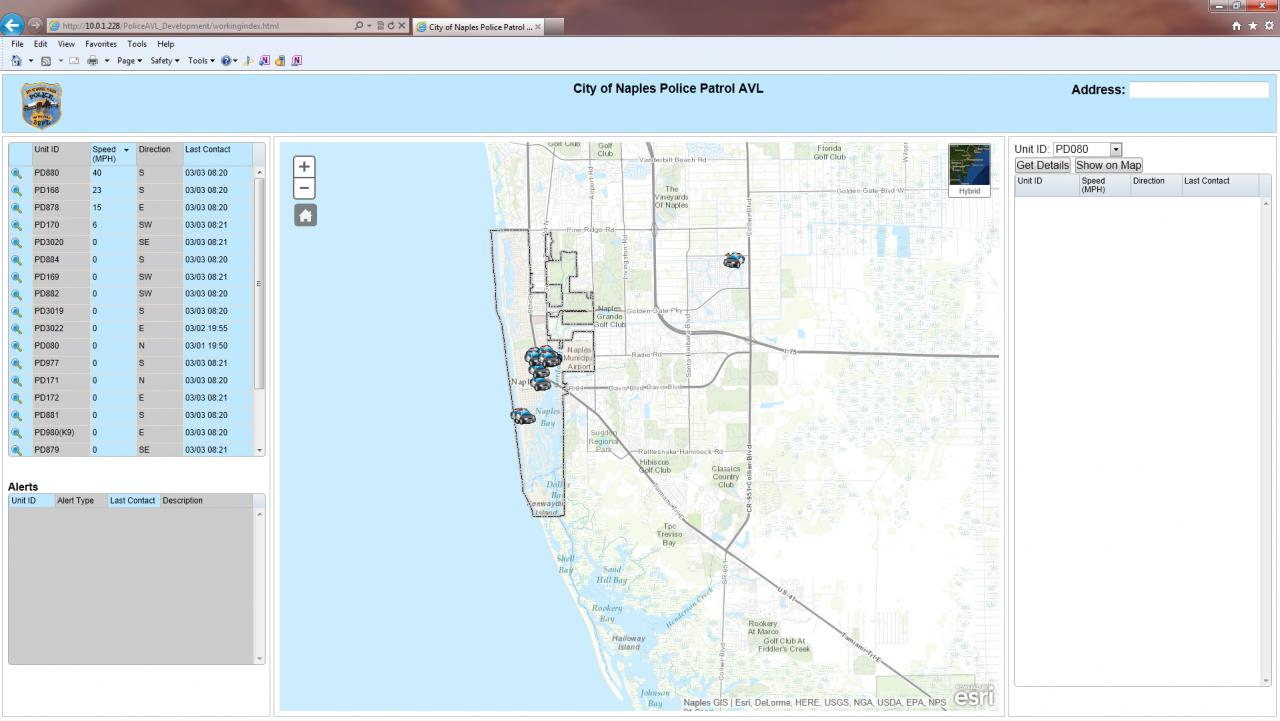
The feature layer is already included in the webpage in on demand mode. What I am trying to do is query the layer so that the only items that show up from that layer are the items from one specific unit id. This is to show the history of one specific vehicle over time. Eventually we would also want to query the time so that the user can specify a certain time and date to get the historical information for one specific vehicle. I am posting a photo of the viewer.
[ATTACH=CONFIG]31992[/ATTACH]
The dropdown menu in the right panel has the unit id's for all police vehicles. What I want is for the historical data (in the historical feature layer) to be shown for whatever specific unit id is selected when I click on the show on map button.
I am fairly new to coding with esri, so any help is appreciated.
on(dom.byId("mapshow"), "click", selectHistorical); function selectHistorical(){ var queryTask = new QueryTask(window.historicalUrl); var query = new Query(); query.returnGeometry=true; query.outFields=window.historicalOutFields; query.text = dom.byId("mydropdown").value; query.outSpatialReference = {"wkid":2236}; dojo.connect(queryTask, "onComplete", function(featureSet){ map.graphics.clear(); dojo.forEach(featureSet.features, function(feature){ var graphic = feature; map.graphics.add(graphic); }); }); queryTask.execute(query); }The feature layer is already included in the webpage in on demand mode. What I am trying to do is query the layer so that the only items that show up from that layer are the items from one specific unit id. This is to show the history of one specific vehicle over time. Eventually we would also want to query the time so that the user can specify a certain time and date to get the historical information for one specific vehicle. I am posting a photo of the viewer.
[ATTACH=CONFIG]31992[/ATTACH]
The dropdown menu in the right panel has the unit id's for all police vehicles. What I want is for the historical data (in the historical feature layer) to be shown for whatever specific unit id is selected when I click on the show on map button.
I am fairly new to coding with esri, so any help is appreciated.
Solved! Go to Solution.
15 Replies
03-07-2014
12:13 PM
- Mark as New
- Bookmark
- Subscribe
- Mute
- Subscribe to RSS Feed
- Permalink
depending on how you code it might be in console or you can see the request being send and the reply in the net tab ie:
when you click the query button you should see the request and the response:
[ATTACH=CONFIG]32027[/ATTACH]
I personally always take the points and do a for loop and position all the points features.geometry using map.graphic.
Im at home at the moment but if you can see if you get the response and the data from that .value is what you expecting im sure i can help without my work laptop.
03-10-2014
04:31 AM
- Mark as New
- Bookmark
- Subscribe
- Mute
- Subscribe to RSS Feed
- Permalink
I was having trouble getting this to work with the wkid 2236, but was able to get it to work using a the geographic coordinate system 4326. Here was the function I used:
You will need to add the following modules:
SpatialReference, Point, SimpleMarkerSymbol, SimpleLineSymbol, and Graphic
function selectHistorical() { var queryTask = new QueryTask(window.historicalUrl); var query = new Query(); query.returnGeometry = true; query.outFields = window.historicalOutFields; query.where = "DeviceId = '" + dom.byId("mydropdown").value + "'"; query.outSpatialReference = { "wkid": 4326 }; dojo.connect(queryTask, "onComplete", function (featureSet) { map.graphics.clear(); dojo.forEach(featureSet.features, function (feature) { var point = new Point(feature.geometry.x, feature.geometry.y, new SpatialReference({wkid:4326})); var simpleMarkerSymbol = new SimpleMarkerSymbol(SimpleMarkerSymbol.STYLE_SQUARE, 10, new SimpleLineSymbol(SimpleLineSymbol.STYLE_SOLID, new Color([0,255,0,0.25]), 1), new Color([255,0,0]) ) var graphic = new Graphic(point, simpleMarkerSymbol); map.graphics.add(graphic); }); }); queryTask.execute(query); }You will need to add the following modules:
SpatialReference, Point, SimpleMarkerSymbol, SimpleLineSymbol, and Graphic
03-10-2014
04:31 AM
- Mark as New
- Bookmark
- Subscribe
- Mute
- Subscribe to RSS Feed
- Permalink
depending on how you code it might be in console or you can see the request being send and the reply in the net tab ie:
when you click the query button you should see the request and the response:
[ATTACH=CONFIG]32027[/ATTACH]
I personally always take the points and do a for loop and position all the points features.geometry using map.graphic.
Im at home at the moment but if you can see if you get the response and the data from that .value is what you expecting im sure i can help without my work laptop.
I am getting the correct response to the query I am executing, but at the bottom, it shows exceededTransferLimit as true. It is trying to place almost 8000 records in the map. This is because I am querying a historical layer that has history for at least 30 days where the vehicle is updating location every 5 seconds. Is there a way for it not to exceed the transfer limit? I feel like this is what is hanging it up from being placed in the map.
03-10-2014
05:27 AM
- Mark as New
- Bookmark
- Subscribe
- Mute
- Subscribe to RSS Feed
- Permalink
Jake,
I found out from the guy doing the services that the spatial reference was changed to world spatial reference instead of NAD 83 which is what it was, so that's why the wkid wasn't working. I was able to copy the code that you used, and the information is now populating in the map. Do you know how I could get a popup to be active on that layer once it is brought in? We would like to see the information for each point, but cannot currently do that.
Thanks for your help.
03-10-2014
05:58 AM
- Mark as New
- Bookmark
- Subscribe
- Mute
- Subscribe to RSS Feed
- Permalink
Here is an update to the function to show a popup once the point is displayed:
Don't forget to add the InfoTemplate module.
dojo.connect(queryTask, "onComplete", function (featureSet) {
                map.graphics.clear();
                dojo.forEach(featureSet.features, function (feature) {
                    var point = new Point(feature.geometry.x, feature.geometry.y, new SpatialReference({wkid:4326}));
                    var simpleMarkerSymbol = new SimpleMarkerSymbol(SimpleMarkerSymbol.STYLE_SQUARE, 10,
                      new SimpleLineSymbol(SimpleLineSymbol.STYLE_SOLID,
                      new Color([0,255,0,0.25]), 1),
                      new Color([255,0,0])
                    )

                    attr = {"Velocity": feature.attributes.Velocity};
                    var infoTemplate = new InfoTemplate("Attributes", "Velocity: ${Velocity}");

                    var graphic = new Graphic(point, simpleMarkerSymbol, attr, infoTemplate);
                    map.graphics.add(graphic);

                    featureArray = [];
                    featureArray.push(graphic);

                    map.infoWindow.setFeatures(featureArray);
                    map.infoWindow.show(point);
                });
});
Don't forget to add the InfoTemplate module.
03-10-2014
08:41 AM
- Mark as New
- Bookmark
- Subscribe
- Mute
- Subscribe to RSS Feed
- Permalink
Thanks so much Jake! That was exactly what I needed. Now to figure out how to get the data for a specific time period using a calendar picklist.....:rolleyes:
- « Previous
-
- 1
- 2
- Next »
- « Previous
-
- 1
- 2
- Next »