- Home
- :
- All Communities
- :
- Developers
- :
- JavaScript Maps SDK
- :
- JavaScript Maps SDK Questions
- :
- Re: Problem with geometry.getCentroid method
- Subscribe to RSS Feed
- Mark Topic as New
- Mark Topic as Read
- Float this Topic for Current User
- Bookmark
- Subscribe
- Mute
- Printer Friendly Page
- Mark as New
- Bookmark
- Subscribe
- Mute
- Subscribe to RSS Feed
- Permalink
I have the following line of code:
this.centerPoint = this.graphic.geometry.getCentroid();
When I run the program and step through the code, the value of geometry.rings is:
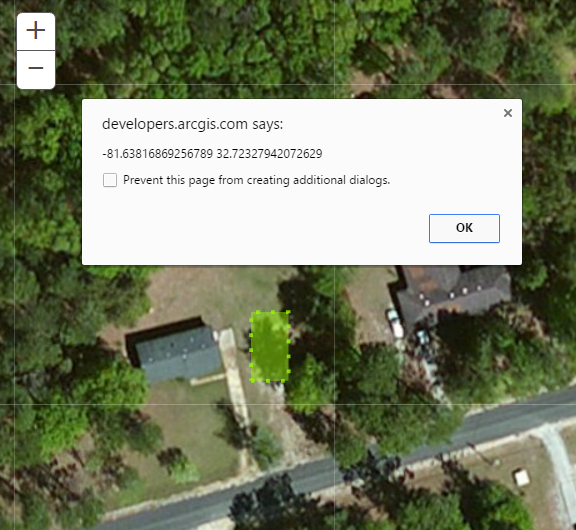
[-81.63820933449949,32.72321758156744,-81.6381280506363,32.72321758156744,-81.6381280506363,32.723341259885146,-81.63820933449949,32.723341259885146,-81.63820933449949,32.72321758156744]
But when I examine the X and Y values of the resultant centerpoint variable, they look opposite from what I would expect:
X = 81.6392691466801
Y = -32.7237205172898
Which would move the geometry from the southeastern U.S. to somewhere in the Indian ocean. Obviously I'm doing something wrong. Any guesses?
Solved! Go to Solution.
Accepted Solutions
- Mark as New
- Bookmark
- Subscribe
- Mute
- Subscribe to RSS Feed
- Permalink
Hello Dave,
Your coordinates looks like is in counter-clockwise direction. The documentation in the addRing method says:
add points counter-clockwise to create a hole
May be thats what is causing the problem. At this point I am not sure if the Polygon constructor behaves the same way as the addRing does. as It seem you are getting the right centriod when creating the geometry as part of json parameter.
Hope this was helpful.
Thejus
- Mark as New
- Bookmark
- Subscribe
- Mute
- Subscribe to RSS Feed
- Permalink
I dont know what you are doing but the sign of your coordinates are getting flipped. normally this is a coordinate system problem, but you seem to have some graphic
- Mark as New
- Bookmark
- Subscribe
- Mute
- Subscribe to RSS Feed
- Permalink
Let me know if you need any additional info.
- Mark as New
- Bookmark
- Subscribe
- Mute
- Subscribe to RSS Feed
- Permalink
I don't know how you get the centroid values. Are they calculated from the input list? If calculated directly, then it is a bug, otherwise something is missing in between Robert Scheitlin, GISP might know since it might be a java thing
- Mark as New
- Bookmark
- Subscribe
- Mute
- Subscribe to RSS Feed
- Permalink
Dave,
Can I see more of your code where you create this polygon? Are you specifying a spatial reference for the polygon?
- Mark as New
- Bookmark
- Subscribe
- Mute
- Subscribe to RSS Feed
- Permalink
Maybe this is an issue I need to push up to my dev lead - he's the one who wrote the code that actually creates the layers and features. I think the spatial reference id is 4326 - whatever that means. I'm not really good at this gis stuff- .net development is more my thing.
I'll see if I can scare up that code in the morning.
- Mark as New
- Bookmark
- Subscribe
- Mute
- Subscribe to RSS Feed
- Permalink
in short, it is a geographic coordinate system... without all the details, the coordinates are in decimal degrees. The part of the issue to focus on is the point between the polygon, or sequence of points was created to where the centroid geometry is calculated. It is quite common for the longitude (-81ish) to have the -ve sign dropped, but not to have both switched.
- Mark as New
- Bookmark
- Subscribe
- Mute
- Subscribe to RSS Feed
- Permalink
Hi Dave,
I am using the following code to construct the geometry
var polygon = new Polygon({
"rings": [
[
[-81.63820933449949,32.72321758156744],
[-81.6381280506363,32.72321758156744],
[-81.6381280506363,32.723341259885146],
[-81.63820933449949,32.723341259885146],
[-81.63820933449949,32.72321758156744]
]
],
"spatialReference": {
"wkid": 4326
}
});
for this geometry the Cendroid is the following
alert(selected.geometry.getCentroid().x + " " + selected.geometry.getCentroid().y);
as you can see the cendroid point has the right coordinates.
check how the polygon constructed.
- Mark as New
- Bookmark
- Subscribe
- Mute
- Subscribe to RSS Feed
- Permalink
Working my way backwards through the code, it seems that the graphic that contains the geometry is captured by a map layer's click event. The event handler that is called when the graphic is clicked on the map grabs the graphic from the event args passed to the event handler.
I'm gonna try to untangle this spaghetti and see where the map layer is actually being created and see what that looks like.
More later.
- Mark as New
- Bookmark
- Subscribe
- Mute
- Subscribe to RSS Feed
- Permalink
So here is the function that creates the graphics for the layer. This function runs in response to a dojo ajax request to get the graphic data from the server. Not sure what these various functions/objects represent. Let me know if something jumps out at you or if you want to know the values of any of the variables.
this.graphicLayer.evalGoodResult = dojo.hitch(this.graphicLayer, function (data) {
if (data.length > 0) {
//feature layers have one common symbol
var defaultSymbol = this.customRenderer.theSymbol;
//load the specified shapes into the layer
this.suspend();
var shapeLoader = this.shapeLoader;
var shapeField = this.shapeField;
var srid = this.defaultSrid;
var shape, attr;
for (idxShape in data) {
//validate and load the geometry and attributes
if (shape) {
//get the symbol for this feature
this.customRenderer.getSymbol(attr);
//create a graphic for it
new esri.Graphic(shape, symbol, attr);
//determine if this graphic will be visible according to our renderer
this.customRenderer.isVisible(attr);
//add to the layer
this.add(theGraphic);
this.resume();