- Home
- :
- All Communities
- :
- Developers
- :
- JavaScript Maps SDK
- :
- JavaScript Maps SDK Questions
- :
- PopupTemplate.content with method in 4.0
- Subscribe to RSS Feed
- Mark Topic as New
- Mark Topic as Read
- Float this Topic for Current User
- Bookmark
- Subscribe
- Mute
- Printer Friendly Page
- Mark as New
- Bookmark
- Subscribe
- Mute
- Subscribe to RSS Feed
- Permalink
with 3.x I used to be able to call a method whenever the info template was shown like infoTemplate.setcontent(mymethod); I dont see a way to do this in 4.0, or even a way to set the content when the pop up is shown. any feedback is appreciated!
Solved! Go to Solution.
Accepted Solutions
- Mark as New
- Bookmark
- Subscribe
- Mute
- Subscribe to RSS Feed
- Permalink
We do plan to add the ability for you to modify the popup title and content as you were able to do at 3.x using the 'function' concept in a future release of the 4.0 API
- Mark as New
- Bookmark
- Subscribe
- Mute
- Subscribe to RSS Feed
- Permalink
This sample shows how to set the content when showing a popup:
- Mark as New
- Bookmark
- Subscribe
- Mute
- Subscribe to RSS Feed
- Permalink
yeah that shows how to set the content using the property with plain text but i want to pass a method to that content parameter so it gets called when the pop up is shown, info template used to support that.
- Mark as New
- Bookmark
- Subscribe
- Mute
- Subscribe to RSS Feed
- Permalink
I am not sure if there a plan to implement that in future. In 4.0 there is no option to set the content through function. Instead they have provided many features in the PopupTemplate through which you can customize the popup content. Format the field vaules. add own actions etc. Its more generic popup now.
If you could let us know what is that specfic functionality you want to achieve through the function, we could let you know the alternative ways to do it.
- Mark as New
- Bookmark
- Subscribe
- Mute
- Subscribe to RSS Feed
- Permalink
If this is true, I'm a sad panda. I use formatting functions for all my infoWindows. For the most part, I use these functions to format the content into HTML table formats so that field names (or more user friendly substitute names) align consistently with each other and field values. I also manipulate the results returned to create additional content for the infoWindows. Here's an example where I create a graph using the Highcharts JS library:
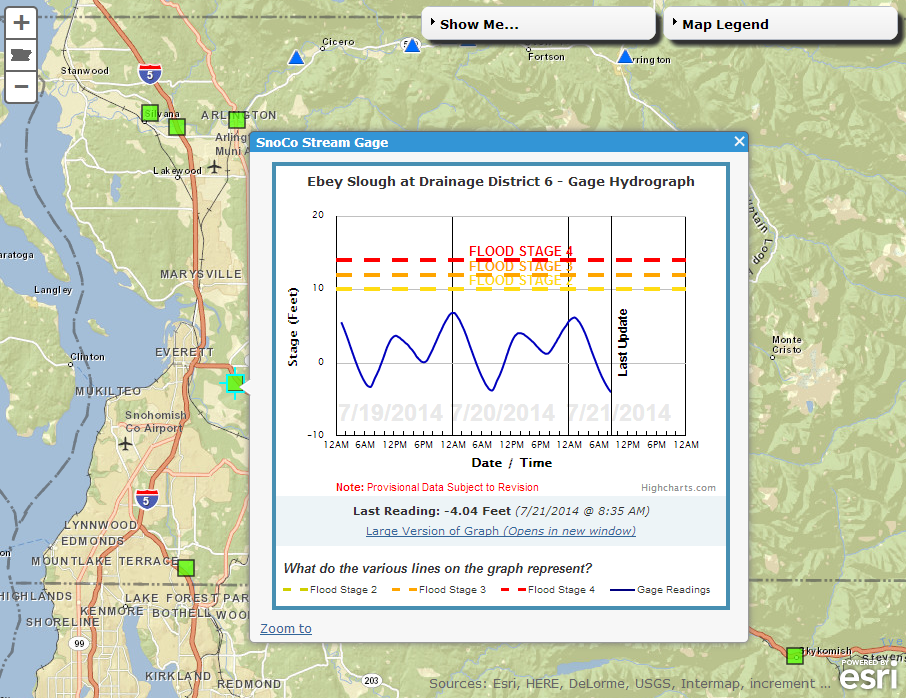
I couldn't replicate when I needed using the Dojo Chart widgets so I had to switch to using Highcharts. Here's another example from a different application:
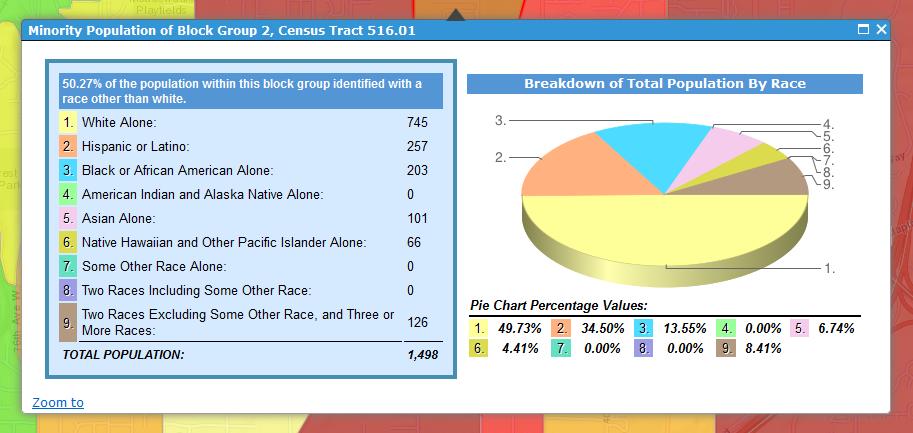
In this example, I'm creating a formatted HTML table on the left hand side and creating a pie chart using Google's charting API on the right.
Steve
- Mark as New
- Bookmark
- Subscribe
- Mute
- Subscribe to RSS Feed
- Permalink
You may not be able to do these things using PopupTemplate. But you can do it using the Popup widget. Popup widget is like a control which you can show when ever you want.
You could use the layer click event get the feature, build the content you want and then show it with Popup widget.
- Mark as New
- Bookmark
- Subscribe
- Mute
- Subscribe to RSS Feed
- Permalink
At this point, there are so many holes in the 4.0 release that I'm unlikely to migrate any apps to it for the foreseeable future. When I originally started developing with the JS API, I used the method you described (setting content via layer.onClick event). I stopped doing this for some reason and now I'm worried that there was some reason I did which now proves to be an issue in a 4.x world moving forward. Oh well.
ESRI giveth and ESRI taketh away.
- Mark as New
- Bookmark
- Subscribe
- Mute
- Subscribe to RSS Feed
- Permalink
We do plan to add the ability for you to modify the popup title and content as you were able to do at 3.x using the 'function' concept in a future release of the 4.0 API
- Mark as New
- Bookmark
- Subscribe
- Mute
- Subscribe to RSS Feed
- Permalink
Great to hear, thank you.
- Mark as New
- Bookmark
- Subscribe
- Mute
- Subscribe to RSS Feed
- Permalink
that is great to hear indeed! I am loading crime data into the map from SQL as graphics but since there are so many points retrieving the entire content of the data is just too slow so I am lazy loading the content, I only grab what I need to draw it on the map but if the user wants to see the details of a crime that's when I fetch the rest of the data, that's where I need the method call. I also use it to do some other stats calculations for polygon layers like law beats, neighborhoods, fire districts etc. I need the method call to inject a "crime" attribute to the features so I can show charts with stats per polygon which get calculated on the fly depending on what is being shown on the map.