- Home
- :
- All Communities
- :
- Developers
- :
- JavaScript Maps SDK
- :
- JavaScript Maps SDK Questions
- :
- Re: Plot a symbol using bing maps
- Subscribe to RSS Feed
- Mark Topic as New
- Mark Topic as Read
- Float this Topic for Current User
- Bookmark
- Subscribe
- Mute
- Printer Friendly Page
- Mark as New
- Bookmark
- Subscribe
- Mute
- Subscribe to RSS Feed
- Permalink
I am trying to plot a symbol using esri and bing maps, the symbol is not coming on the map. I'm not sure how it is done. Any help will be useful. I've attached my code.
Solved! Go to Solution.
Accepted Solutions
- Mark as New
- Bookmark
- Subscribe
- Mute
- Subscribe to RSS Feed
- Permalink
Bhaskar,
FYI, normally you would mark a thread as assumed answered when you have answered your own question or you have resolved your issue with no correct answer from others. When others have replied to your question and have provided the answer then you mark that reply as the correct answer and mark all replies that were helpful by clicking on the Helpful Yes | No links.
- Mark as New
- Bookmark
- Subscribe
- Mute
- Subscribe to RSS Feed
- Permalink
Hello Bhaskar,
Have you tried running the html file in your Welcome.html.zip?
It also has two typo's according to my IDE
- Mark as New
- Bookmark
- Subscribe
- Mute
- Subscribe to RSS Feed
- Permalink
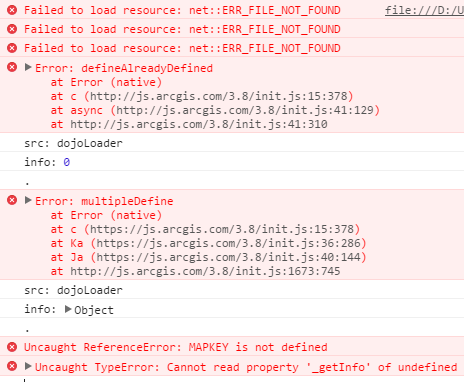
Hi Cees,
You are correct about the error message. I'm sorry for not providing the information about the MAPKEY. It is a licensed key for bing maps. So I cant provide the key here in the forum. On providing the key the map come up. If you have any key, can you please try with that and inform me about what should be done to get the symbol on the map.
- Mark as New
- Bookmark
- Subscribe
- Mute
- Subscribe to RSS Feed
- Permalink
Bhaskar,
Here is Tim's updated AMD code that has been tested to work with a BING key and it draws the point graphic in the centroid of the polygon:
<!DOCTYPE html PUBLIC "-//W3C//DTD HTML 4.01 Transitional//EN" "http://www.w3.org/TR/html4/loose.dtd">
<html>

<head>
  <meta http-equiv="Content-Type" content="text/html; charset=ISO-8859-1">
  <title>Insert title here</title>
  <!--<link rel="stylesheet" type="text/css" href="extjs/resources/ext-theme-gray/ext-theme-gray-all.css">-->
  <link rel="stylesheet" href="http://js.arcgis.com/3.14/dijit/themes/claro/claro.css">
  <link rel="stylesheet" href="http://js.arcgis.com/3.14/esri/css/esri.css">
  <!--<script type="text/javascript" src="extjs/ext-all.js"></script>-->
  <!--<script type="text/javascript" src="app.js"></script>-->
  <title>Create Map and add a dynamic layer</title>
  <style>
    html,
    body,
    #mapDiv {
      padding: 0;
      margin: 0;
      height: 100%;
    }
  </style>
  <script src="http://js.arcgis.com/3.14/"></script>
  <script>
    var map;
    //var targetLocationLayer = null;
    require([
      "esri/map",
      "esri/layers/ArcGISDynamicMapServiceLayer",
      "esri/layers/ImageParameters",
      "esri/symbols/PictureMarkerSymbol",
      "esri/graphic",
      "esri/virtualearth/VETiledLayer",
      "esri/geometry/Polygon",
      "esri/geometry/Point",
      "esri/layers/GraphicsLayer",
      "esri/renderers/SimpleRenderer",
      "esri/symbols/SimpleFillSymbol",
      "esri/symbols/SimpleLineSymbol",
      "esri/Color",
      "esri/geometry/webMercatorUtils",
      "dojo/domReady!"
], function (
      Map, ArcGISDynamicMapServiceLayer, ImageParameters, PictureMarkerSymbol, Graphic, VETiledLayer, Polygon, Point, GraphicsLayer, SimpleRenderer, SimpleFillSymbol, SimpleLineSymbol, Color, webMercatorUtils) {
      map = new Map("mapDiv", {
        sliderOrientation: "horizontal"
        //center: [-85, 34],
        //zoom: 10
      });
      var baseMapLayer = new VETiledLayer({
        bingMapsKey: "yourbingkey",
        mapStyle: VETiledLayer.MAP_STYLE_AERIAL_WITH_LABELS,
        id: 'bingMapLayerId'
      });
      map.addLayer(baseMapLayer);
      var points = new Array();
      var polygon = new Polygon();
      var point;
      /* for(var i=0;i<4;i++) {
      var point = esri.geometry.xyToLngLat(-8120678.884666368, 5016287.223394099);
      points = new esri.geometry.Point(point[0], point[1]);
      } */
      point = webMercatorUtils.xyToLngLat(-8303533.953231358, 4917717.3663619868);
      points[0] = new Point(point[0], point[1]);
      point = webMercatorUtils.xyToLngLat(-8303533.7143373974, 4917697.7793284087);
      points[1] = new Point(point[0], point[1]);
      point = webMercatorUtils.xyToLngLat(-8303602.0299349511, 4917698.4960196903);
      points[2] = new Point(point[0], point[1]);
      point = webMercatorUtils.xyToLngLat(-8303602.2688289117, 4917717.6051774034);
      points[3] = new Point(point[0], point[1]);
      point = webMercatorUtils.xyToLngLat(-8303533.953231358, 4917717.3663619868);
      points[4] = new esri.geometry.Point(point[0], point[1]);
      /*point = esri.geometry.xyToLngLat(-8120678.884666368, 5016287.223394099);
      points[5] = new esri.geometry.Point(point[0], point[1]);*/
      polygon.addRing(points);
      console.log(polygon);
      //var map = this.getMap();
      //var locationLayer = this.getTargetLocationLayer();
      //if (locationLayer)
      // map.removeLayer(locationLayer);
      var locationLayer = new GraphicsLayer();
      locationLayer.renderer = new SimpleRenderer();
      //this.setTargetLocationLayer(locationLayer);
      map.addLayer(locationLayer);
      var symbol = new SimpleFillSymbol(SimpleFillSymbol.STYLE_NULL,
        new SimpleLineSymbol(SimpleLineSymbol.STYLE_SOLID,
          new Color([255, 0, 0]), 2), new Color([255, 255, 0, 0.25])
      );
      locationLayer.add(new Graphic(polygon, symbol));
      /* locationLayer.add(new esri.Graphic(
      polygon.getCentroid(), */

      var psymbol = new PictureMarkerSymbol({
        "angle": 0,
        "xoffset": 0,
        "yoffset": 11,
        "type": "esriPMS",
        "url": "http://static.arcgis.com/images/Symbols/Shapes/BluePin1LargeB.png",
        "contentType": "image/png",
        "width": 28,
        "height": 28
      });
      console.log(symbol);

      locationLayer.add(new Graphic(polygon.getCentroid(), psymbol));

      //map.graphics.add(new Graphic(-74.59215994720809, 40.35526232626358,symbol));

      //map.graphics.add(new Graphic("point", symbol));

      var renderer = new SimpleRenderer(symbol);

      console.log(polygon.getCentroid());
      map.centerAndZoom(polygon.getCentroid(), 20);


      //window.setInterval(function () {alert("Hello")}, 3000);

      /* var locationLayer = new esri.layers.GraphicsLayer();
      locationLayer.renderer = new esri.renderer.SimpleRenderer(); */
    });
  </script>
</head>

<body>
  <div id="mapDiv"></div>
</body>

</html>
- Mark as New
- Bookmark
- Subscribe
- Mute
- Subscribe to RSS Feed
- Permalink
Thanks for the help. Can you also tell me how do I plot the symbol on a fxed coordinate?
- Mark as New
- Bookmark
- Subscribe
- Mute
- Subscribe to RSS Feed
- Permalink
Bhaskar,
Sure it would be:
locationLayer.add(new Graphic(new Point(-74.6162653, 40.3452031), psymbol));
Don't forget to mark this thread as answered.
- Mark as New
- Bookmark
- Subscribe
- Mute
- Subscribe to RSS Feed
- Permalink
The code mentioned above for particular coordinate It is not working.Can you help me better.
- Mark as New
- Bookmark
- Subscribe
- Mute
- Subscribe to RSS Feed
- Permalink
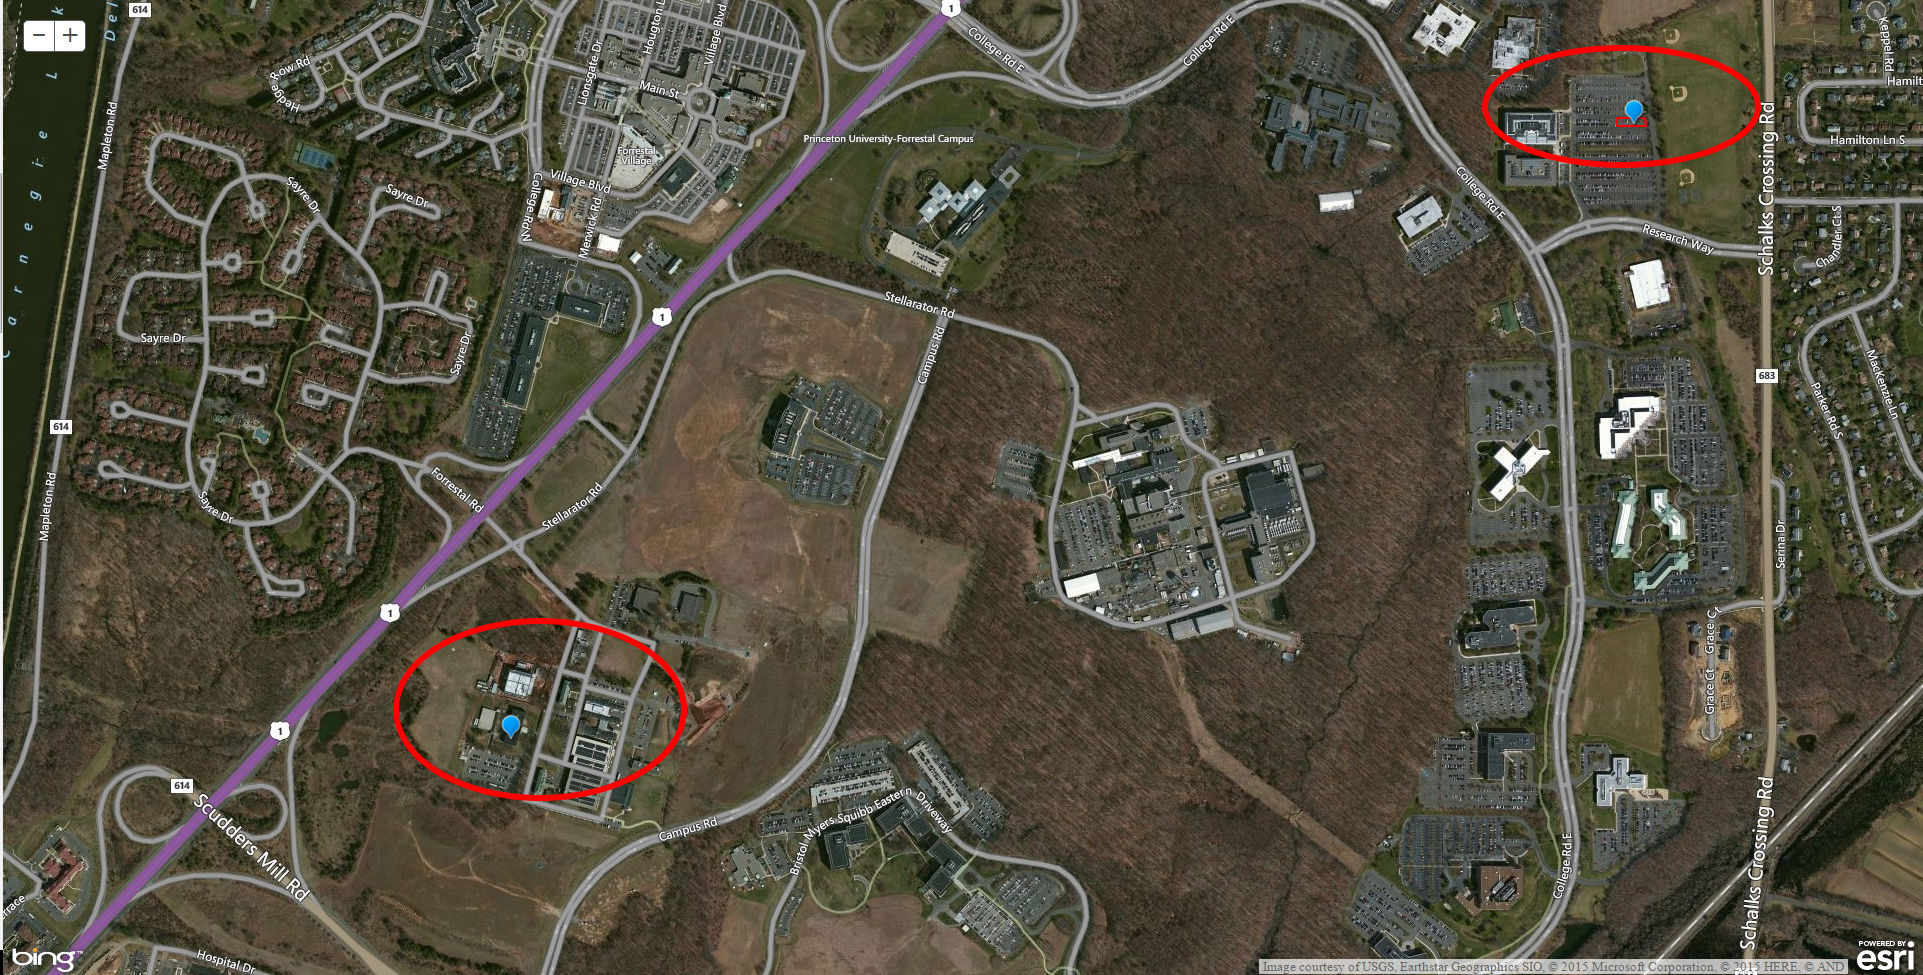
Bhaskar,
Works fine for me. See the attached image.
- Mark as New
- Bookmark
- Subscribe
- Mute
- Subscribe to RSS Feed
- Permalink
Thanks for the help.It working fine.