- Home
- :
- All Communities
- :
- Developers
- :
- JavaScript Maps SDK
- :
- JavaScript Maps SDK Questions
- :
- map.graphics.add not working in FeatureLayer's cli...
- Subscribe to RSS Feed
- Mark Topic as New
- Mark Topic as Read
- Float this Topic for Current User
- Bookmark
- Subscribe
- Mute
- Printer Friendly Page
map.graphics.add not working in FeatureLayer's click event but work in mouse-over event
- Mark as New
- Bookmark
- Subscribe
- Mute
- Subscribe to RSS Feed
- Permalink
I tried to add a graphic with new symbol
such as
var symbol = new SimpleFillSymbol(....
var g = new Graphic(evt.graphic.geometry, symbol );
map.graphics.add(g);
it works in feature's mouse-over (hover) but not click event?..
i.e.. work in layer.on('mouse-over', function (evt) { ...
but not in layer.on('click', function (evt) { ...
Am I missing something?
Thanks
- Mark as New
- Bookmark
- Subscribe
- Mute
- Subscribe to RSS Feed
- Permalink
Try to create a graphic layer and push the graphics on it.
then add the click event on the graphic layer
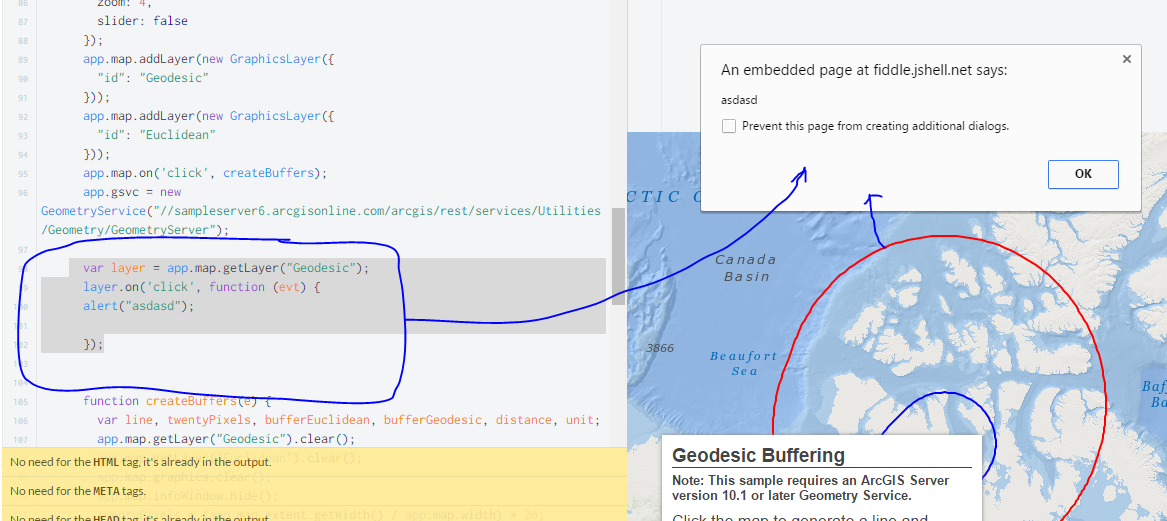
var layer = app.map.getLayer("Geodesic");
layer.on('click', function (evt) {
alert("asdasd");
});
see an example here Edit fiddle - JSFiddle
on line 98 to 102 you will find the click event.
this sample creates buffers around a line (click on the map to be created) and after that the red line (Geodesic graphic layer) has the click event. When you click on the red line the alert box arise.
- Mark as New
- Bookmark
- Subscribe
- Mute
- Subscribe to RSS Feed
- Permalink
the click did fired, it just didn't draw any graphic on it..
I tried the example too.. same thing.. it works in layer's mouse-over, but not layer's click
- Mark as New
- Bookmark
- Subscribe
- Mute
- Subscribe to RSS Feed
- Permalink
I think I have figured out..
the map's click event work, but the featurelayer's click event won't work.
both of them fire, however only the map version draws the graphic.
Could be bug?
- Mark as New
- Bookmark
- Subscribe
- Mute
- Subscribe to RSS Feed
- Permalink
I am having a similar problem, however; my click event fires but the graphic is not added to the map. Does anyone know what I might be doing wrong?
See line 121 below:
<!DOCTYPE html>
<html>
<head>
<meta http-equiv="Content-Type" content="text/html; charset=utf-8">
<meta name="viewport" content="initial-scale=1, maximum-scale=1,user-scalable=no">
<title>Select with feature layer</title>
<link rel="stylesheet" href="https://js.arcgis.com/3.18/dijit/themes/tundra/tundra.css">
<link rel="stylesheet" href="https://js.arcgis.com/3.18/esri/css/esri.css">
<style>
html, body, #mapDiv {
padding: 0;
margin: 0;
height: 100%;
}
#messages{
background-color: #fff;
box-shadow: 0 0 5px #888;
font-size: 1.1em;
max-width: 15em;
padding: 0.5em;
position: absolute;
right: 20px;
top: 20px;
z-index: 40;
}
</style>
<script src="https://js.arcgis.com/3.18/"></script>
<script>
var map;
require([
"esri/map", "esri/layers/FeatureLayer",
"esri/layers/ArcGISTiledMapServiceLayer",
"esri/tasks/QueryTask",
"esri/tasks/query",
"esri/graphic", "esri/InfoTemplate",
"esri/symbols/SimpleLineSymbol", "esri/symbols/SimpleFillSymbol", "esri/renderers/SimpleRenderer",
"esri/config", "esri/Color", "dojo/dom", "dojo/domReady!"
], function(
Map, FeatureLayer,
ArcGISTiledMapServiceLayer,
QueryTask,
Query,
Graphic, InfoTemplate,
SimpleLineSymbol, SimpleFillSymbol, SimpleRenderer,
esriConfig, Color, dom
) {
map = new Map("mapDiv", {
center: [-96.8, 32.781],
basemap: "streets",
zoom: 14,
slider: true
});
//add the tax parcel feature layer
var taxParcels = new FeatureLayer("https://maps.dcad.org/prdwa/rest/services/Property/ParcelQuery/MapServer/4",{
mode: FeatureLayer.MODE_SELECTION,
infoTemplate: new InfoTemplate("Parcel ID: ${PARCELID}", "${*}"),
outFields: ["PARCELID","LOWPARCELID","SITEADDRESS", "OWNERNME1", "MAPGRID"]
});
//add feature layer for blocks
var blocks = new FeatureLayer("https://maps.dcad.org/prdwa/rest/services/Property/ParcelQuery/MapServer/0", {
mode: FeatureLayer.MODE_ONDEMAND
});
// define block selection symbol
var selectedBlockSymbol = new SimpleFillSymbol(
SimpleFillSymbol.STYLE_SOLID,
new SimpleLineSymbol(
SimpleLineSymbol.STYLE_SOLID,
new Color([255,255,255,0.35]),
1
),
new Color([125,125,125,0.35])
);
// add block layer
map.addLayer(blocks);
//make unselected features invisible
var nullSymbol = new SimpleFillSymbol(SimpleFillSymbol.STYLE_NULL);
taxParcels.setRenderer(new SimpleRenderer(nullSymbol));
// add tax parcels layer
map.addLayer(taxParcels);
//when the map is clicked select the block
blocks.on("click", function(evt){
console.log("Click event fired!");
var query = new Query();
var selectedBlock;
query.geometry = evt.mapPoint;
query.spatialRelationship = Query.SPATIAL_REL_INTERSECTS;
query.outSpatialReference = map.spatialReference;
//execute query
var queryTask = new QueryTask(blocks.url);
queryTask.execute(query,showResults);
});
function showResults(featureSet) {
//remove all graphics on the maps graphics layer
map.graphics.clear();
//Performance enhancer - assign featureSet array to a single variable.
var resultFeatures = featureSet.features;
//Loop through each feature returned
console.log("There is " + resultFeatures.length.toString() + " block(s) here.");
for (var i=0, il=resultFeatures.length; i<il; i++) {
//Get the current feature from the featureSet.
//Feature is a graphic
var graphic = new Graphic(resultFeatures[i].geometry,selectedBlockSymbol);
//Add graphic to the map graphics layer.
map.graphics.add(graphic);
}
}
});
</script>
</head>
<body>
<span id="messages">Click on the map to select tax parcels within a block.</span>
<div id="mapDiv"></div>
</body>
</html>
- Mark as New
- Bookmark
- Subscribe
- Mute
- Subscribe to RSS Feed
- Permalink
John,
You forgot to set the:
query.returnGeometry = true;
- Mark as New
- Bookmark
- Subscribe
- Mute
- Subscribe to RSS Feed
- Permalink
Thanks Robert! That worked!