- Home
- :
- All Communities
- :
- Developers
- :
- JavaScript Maps SDK
- :
- JavaScript Maps SDK Questions
- :
- Re: internet explorer 8 Pie chart and Bart Chart
- Subscribe to RSS Feed
- Mark Topic as New
- Mark Topic as Read
- Float this Topic for Current User
- Bookmark
- Subscribe
- Mute
- Printer Friendly Page
- Mark as New
- Bookmark
- Subscribe
- Mute
- Subscribe to RSS Feed
- Permalink
Hello I am trying to create a dashboard with Pie chart ad Stacked bar chart. I am using Internet Explorer 8 (official Internet browser of the company). When the rendering happens, I get random results. Please see below:
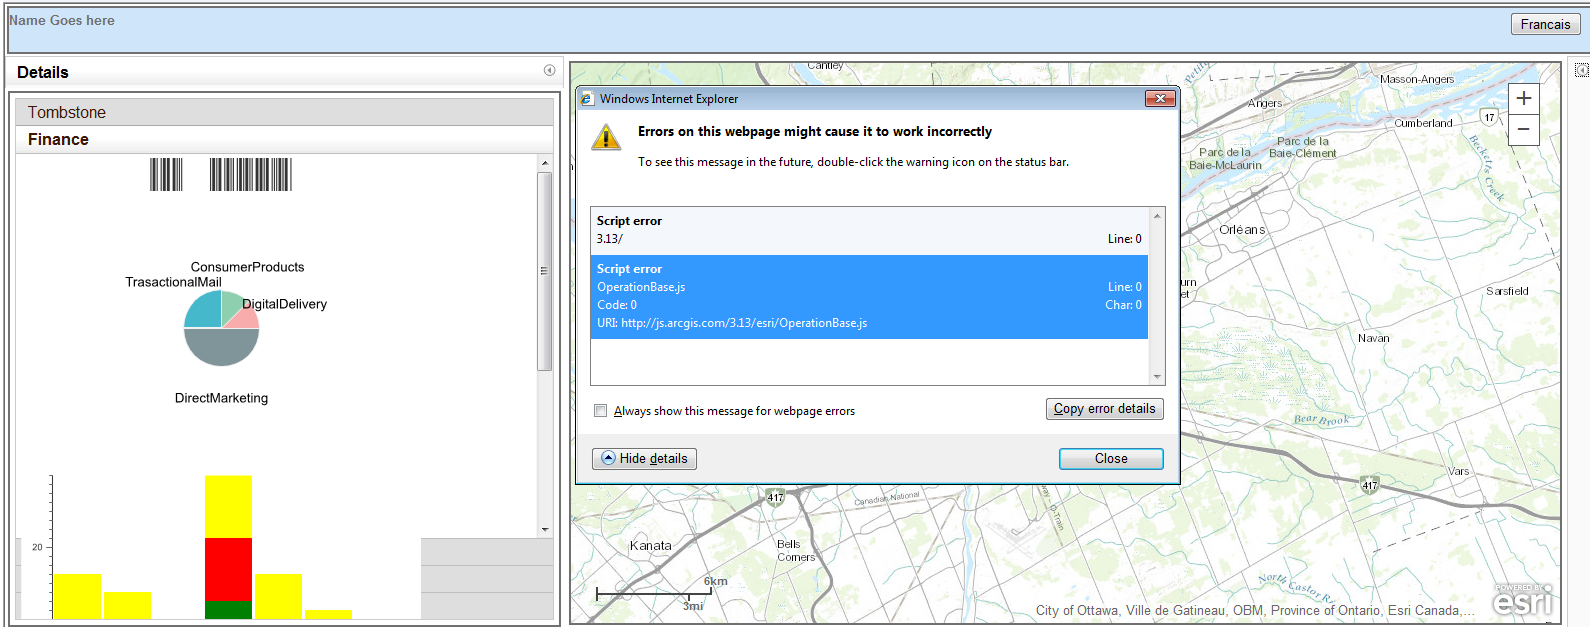
size of the bar chart and font are not at all consistent .
It should be a CSS problem because when I use Chrome or Firefox I get normal charts.
This is a small piece of my code
<!DOCTYPE html PUBLIC "-//W3C//DTD HTML 4.01 Transitional//EN" "http://www.w3.org/TR/html4/loose.dtd">
<html>
  <head>
    <meta http-equiv="Content-Type" content="text/html; charset=utf-8">
    <meta name="viewport" content="initial-scale=1, maximum-scale=1,user-scalable=no">

    <link rel="stylesheet" href="http://js.arcgis.com/3.13/dijit/themes/soria/soria.css">
  <link rel="stylesheet" href="http://js.arcgis.com/3.13/dojox/layout/resources/ExpandoPane.css">
    <link rel="stylesheet" href="http://js.arcgis.com/3.13/esri/css/esri.css">


    <link rel="stylesheet" href="CSS/newPortal.css">
    <script src="http://js.arcgis.com/3.13/"></script>

  </head>
  <script>
require(["dojox/charting/Chart", "dojox/charting/plot2d/Pie", "dojox/charting/action2d/Highlight",
         "dojox/charting/action2d/MoveSlice" , "dojox/charting/action2d/Tooltip",
         "dojox/charting/themes/MiamiNice", "dojox/charting/widget/Legend",   "dojox/charting/axis2d/Default",  "dojox/charting/plot2d/StackedColumns",    "dojox/charting/action2d/Magnify", "dojox/charting/widget/SelectableLegend", "dojo/ready"],
  function(Chart, Pie, Highlight, MoveSlice, Tooltip, MiamiNice, Legend,  Default, StackedColumns, Magnify, SelectableLegend,ready){

    var pieChart = new Chart("pieChart");
  pieChart.title = "BW Sales";
    pieChart.setTheme(MiamiNice)
     .addPlot("default", {
        type: Pie,
        font: "normal normal 11pt Tahoma",
        fontColor: "black",
        labelOffset: -30,
        radius: 80
    }).addSeries("Series A", [
        {y: 4, text: "Red",   stroke: "#9fbf7f", tooltip: "Red is 50%"},
        {y: 2, text: "Green", stroke: "#9fbf7f", tooltip: "Green is 25%"},
        {y: 1, text: "Blue",  stroke: "#287acc", tooltip: "I am feeling Blue!"},
        {y: 1, text: "Other", stroke: "287acc", tooltip: "Mighty <strong>strong</strong><br>With two lines!"}
    ]);
    var anim_a = new MoveSlice(pieChart, "default");
    var anim_b = new Highlight(pieChart, "default");
    var anim_c = new Tooltip(pieChart, "default");
    pieChart.render();
    var legendTwo = new Legend({chart: pieChart}, "legendTwo");
  /*
  */


     var barChart = new dojox.charting.Chart("barChart");
      barChart.addPlot("default",{type: "StackedColumns", gap: 2});
      barChart.addAxis("x");
      barChart.addAxis("y", {vertical: true, includeZero: true});
      barChart.addSeries("A", [2,3,5,7,2,4,6], {plot: "default", fill: "blue", stroke: {color: "blue"}});
      barChart.addSeries("C", [5,4,2,7,5,3,1], {plot: "default", fill: "green", stroke: {color: "green"}});
      barChart.addSeries("D", [5,4,2,7,5,3,1], {plot: "default", fill: "red", stroke: {color: "red"}});
      barChart.addSeries("E", [5,4,2,7,5,3,1], {plot: "default", fill: "yellow", stroke: {color: "yellow"}});


      var tooltip = new Tooltip( barChart, "default", {
        text : function(point) {
          console.debug(point);
          return "This is " + point.y;
        }
      });


      barChart.render();
      var clusteredColumnsLegend = new SelectableLegend({chart: barChart}, "barChartLegend");

    });


  </script>
</head>
<body class="claro">
 <div id="pieChart" style="width: 300px; height: 300px;"></div>
<div id="legendTwo"></div>
<div data-dojo-type="dojox.charting.widget.Chart" id="barChart" style="width: 350px; height: 200px;">


</div>
    <br/>
<div id="barChartLegend"></div>
</body>
</html>
Would it be possible to know what is the problem? How to resolve it?
I have another questions: is there another way to create charts?
Thanks
Abel
Solved! Go to Solution.
Accepted Solutions
- Mark as New
- Bookmark
- Subscribe
- Mute
- Subscribe to RSS Feed
- Permalink
I tried using the dojo charting capabilities but ran into issues (at the time, our organization also used IE-8 as the standard browser version). I would recommend looking into other options (and there are many). For my situation, I use two different options- the Highcharts JS library and the Google charts API. You'll have to evaluate either to see which works best for what you have to do. I will note that the Highcharts option does incur a cost (free to evaluate, though) but the cost seemed minimal ($70 for usage on one site/application).
I've been pretty happy with Highcharts but you mileage may vary.
- Mark as New
- Bookmark
- Subscribe
- Mute
- Subscribe to RSS Feed
- Permalink
You have a script error bubbling-up in OperationBase.js. You can try and debug using IE8's dev console (F12). Here's a reference on debugging using IE8 dev tools, if you haven't done this before:
Debugging Script with the Developer Tools (Internet Explorer)
The issues you are going to run into, continuously, regard limitations with IE8. Unfortunately, this is a legacy browser, and IE8 has reputation for having a poor JavaScript engine.
There are probably incompatibilities with v3.13 of the API, or Dojo for that version, although, according to Esri, IE7+ is supported (Supported Browsers | Guide | ArcGIS API for JavaScript ), so if you find a bug, they would need to fix it, or provide a workaround.
Try using an older version of the API, if possible, just for testing purposes, to see if you can isolate the bug to a specific version. If you find it works in an earlier version, and debugging didn't yield any clues, you could ping Esri to see if this has come-up before.
Honestly, you may have an easier time convincing the powers that be at your organization to upgrade. In January, 2016, only the latest version of IE will be supported for any given, supported Windows OS, so, unless everyone at your organization is running Windows Thin PC, or point-of-sale/embedded Windows, IE8 will not be supported. That means no security patches, bug fixes, etc.:
- Mark as New
- Bookmark
- Subscribe
- Mute
- Subscribe to RSS Feed
- Permalink
I tried using the dojo charting capabilities but ran into issues (at the time, our organization also used IE-8 as the standard browser version). I would recommend looking into other options (and there are many). For my situation, I use two different options- the Highcharts JS library and the Google charts API. You'll have to evaluate either to see which works best for what you have to do. I will note that the Highcharts option does incur a cost (free to evaluate, though) but the cost seemed minimal ($70 for usage on one site/application).
I've been pretty happy with Highcharts but you mileage may vary.
- Mark as New
- Bookmark
- Subscribe
- Mute
- Subscribe to RSS Feed
- Permalink
Highcharts is a pretty nice charting library. It's not too costly, either.
- Mark as New
- Bookmark
- Subscribe
- Mute
- Subscribe to RSS Feed
- Permalink
Esri is experimenting with charts too
Examples can be found here: Cedar Quickstart | Esri Cedar
This one in particular might be of interest:Map and Multiple Charts
- Mark as New
- Bookmark
- Subscribe
- Mute
- Subscribe to RSS Feed
- Permalink
Cool, thanks for the share!
- Mark as New
- Bookmark
- Subscribe
- Mute
- Subscribe to RSS Feed
- Permalink
Hello all
Thank you for your answers.
Unfortunately, there's no way I could convince the company of changing IE8.
Now, Google Earth and High Chart are both very interesting.
All I wanted is to use something that ESRI provides and remain consistent.
It should be possible. Please look this sample this works in IE 8 and shows that something can be done.
Rickey : I tried this cool sample and it failed to load in IE 8 with error:
Message: Script errors
URI: http://square.github.io/crossfilter/d3.v3.min.js
URI: http://esri.github.io/cedar/js/vega.js
URI: http://esri.github.io/cedar/js/cedar-core.js
Thanks again
Abel
- Mark as New
- Bookmark
- Subscribe
- Mute
- Subscribe to RSS Feed
- Permalink
Abel,
I am sorry I did not read that they were still on IE8, I assumed that IE10 would be used.